Hyperbolic geometry squishes graphs
An important theme in information visualization is focus+context: allowing viewers to look at part of a visualization in detail, while still keeping a big picture of the whole. One common method simulates a magnifying glass by having a small zoomed-in window that expands the point your mouse is pointing to. But if this window is placed over the mouse it can block parts of the visualization at an intermediate level of focus, near enough that they’re covered by the zoom window but not so near that they’re visible in it. If it’s off to the side, your eye bounces back and forth between the zoom and the big picture. Instead, another old method for focus+context shows everything in a single view by bringing in hyperbolic geometry. Draw the big visualization in the hyperbolic plane, and then view it using a Poincaré disk model, centered on your point of interest. This smoothly interpolates all scales of interest, from your focus to the whole visualization, into a single view, without any distortion of angles and with controlled distortion of other shape properties.
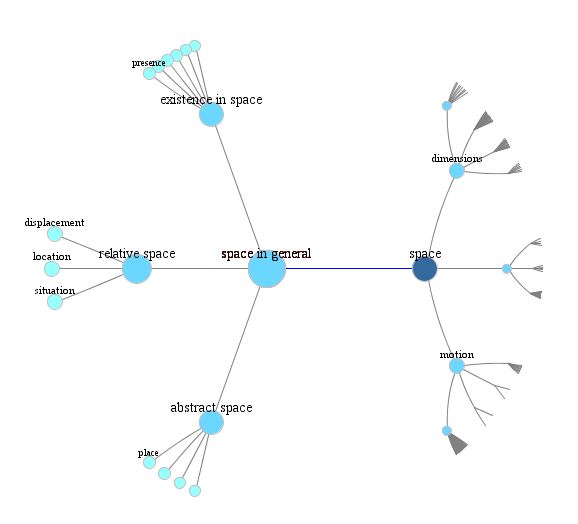
Hyperbolic focus+context seems like it could be a good fit for graph drawing. And it can work pretty well for trees, which always have nice drawings in the hyperbolic plane. Here’s an example of what it ends up looking like, produced by information visualization specialist L. John Old:
But my newest preprint, “Limitations on Realistic Hyperbolic Graph Drawing” (arXiv:2108.07441) argues that for other kinds of graphs, this idea of drawing a graph hyperbolically and then viewing it through a Euclidean model of hyperbolic geometry has some significant limitations, in some ways more severe than the limitations imposed by making Euclidean drawings (and then using some other method for focus+context).
To understand why, it’s important to know that hyperbolic geometry lacks the scalability of Euclidean geometry. What I mean is that, in Euclidean geometry, you can expand any shape or drawing by a constant scale factor and get another drawing that looks the same. The shape of the plane does not depend on the units that you use to measure length: light-years, miles, millimeters, angstroms, etc., all just differ from each other by an arbitrary choice of scale factor. On the other hand, the hyperbolic plane has a single natural unit of length. At smaller scales, it looks very much like the Euclidean plane. At larger scales, the differences between hyperbolic and Euclidean geometry kick in. When we use the Poincaré disk model to view the hyperbolic plane, we see that unit distance. The Euclidean radius of the whole disk model is proportional to the Euclidean size that we would see when viewing an object of unit hyperbolic size at the center of our focus. We can’t zoom in the Poincaré model any deeper than that.
This means that, to use hyperbolic drawings that work with the Poincaré disk model in focus+context applications, we need graph drawings in the hyperbolic plane where the sizes of the parts of the graph we want to zoom in on are not much smaller than the unit of length. But this is just not possible, in many cases. The geometry of the hyperbolic plane forces the features of graphs drawn in it to be squeezed tightly together, much more tightly than unit distance. In particular:
-
Maximal planar graphs can never be drawn planarly with straight edges and with their vertices farther than distance \(O(1/\sqrt{n})\) from the nearest edge, and for some graphs this goes down to \(O(1/n)\).
-
When a maximal planar graph is drawn with straight edges its vertices all constant distance apart from each other (which is always possible), some of its angles will be exponentially sharp.
-
Even very simple graphs like \(K_{1,1,n}\) (below) and the \(n\times n\) grid graphs have both kinds of bad behavior: vertices very close to edges, and (if vertices are well separated) very sharp angles.

-
Nonplanar drawings can be forced to have angles of \(O(1/n^2)\), compared to the Euclidean plane where less-sharp angles proportional to \(1/n\) are always possible.
-
When drawing nonplanar graphs, with nonzero thickness for the edges and nonzero radius for the vertices, you may be forced to use very thin edges with thickness \(O(1/n)\). Otherwise some edges may be completely covered and invisible.
Of course, there still exist plenty of graphs other than the trees and the bad examples of my paper that have nice hyperbolic drawings. It might be interesting to try to characterize which ones they are and to find good drawings when they exist.

I’ll be presenting this at this year’s Graph Drawing symposium, in mid-September, for which registration is currently open. They’re trying a hybrid conference with both limited in-person participation (in Tübingen, Germany) and online participation; I’ll be on the online side, but I’m curious to see how this format works.