In response to Peter Eades
Peter Eades gave a deliberately provocative closing lecture at GD 2010. For the most part I found it interesting, entertaining, and inspiring, although I think his evident underlying assumption that research quality is best measured by return on investment is problematic at best. In any case, among his many points of provocation, two aimed close to the subjects of two of my own papers at the conference, leading me to respond here.
Peter said: 3d is dead. We should be working in two dimensions, or possibly 2½d (via drawings of planar layers stacked on top of each other showing different aspects of a network) rather than in 3d, because 3d drawings are unreadable. His evidence was a drawing of \( K_7 \) that some other researchers had made as an example of what one of Peter's own algorithms produces, and this drawing was indeed unreadable. Based on a look through the conference program, if 3d is not dead, then it's at least in severe decline: my own paper on the subject seems to be the only one this year. Another of Peter's provocative claims was that there is a spectrum in graph drawing between engineering and fine art, that graph drawing research is currently 100% engineering and 0% art, and that we should have graph drawing algorithms that extend across the entire spectrum. As another of my papers was explicitly inspired by fine art, I'd disagree with his 100%-engineering assessment, but I do agree that an aesthetic approach to graph drawing can be a good thing.
So, I took these provocations as a challenge: can we draw \( K_7 \), in 3d, in a way that is both readable and aesthetic? To tie it in to my other paper and its artistic inspiration, I thought it might make even more of an interesting challenge to come up with a nice drawing of \( K_7 \) in a 3d Lombardi style.
Before starting a graph drawing, it's important to have in mind not just the graph one wants to draw, but what information about the graph is supposed to be conveyed by the drawing. What story about \( K_7 \) should the drawing tell? Peter has been a strong proponent of application driven graph drawing research: one should stay in contact with customers of graph drawing applications who don't care about how the software works but do care about visualizing specific graphs related to their own interests in business or the sciences, one should find out from those customers in what ways their needs aren't being met, and one should design not just algorithms but systems that allow these customers to visualize their information better. As an example of this "not algorithms but systems" approach, he was strongly pushing a research direction involving replacing static drawings with interactive manipulation of graphs, focused on simplifying and unsimplifying portions of a large clustered graph in order to allow the system to scale to very large graphs. It's possible to imagine \( K_7 \) arising in an application context in this way: it could represent the connections between seven different entities, with a drawing style that would provide a visual representation of the strength of these connections, or that would provide a distinctive appearance to each of these entities so that they could be distinguished from each other.
But, when I need to draw graphs for my own purposes outside the context of graph drawing research, that's not what I do. When I write papers in other areas of graph theory or graph algorithms, or edit Wikipedia articles that relate to graphs, or write blog posts about graphs, what I typically want is a static image of a small and specific graph that shows off some aspect of its structure: a coloring of its vertices or edges, a distinguished subgraph such as a Hamiltonian cycle, or (most relevantly for \( K_7 \)) its high degree of symmetry. In 2d, the most symmetric drawings I could find of \( K_7 \) have symmetry groups of orders 12 and 14, far below the 5040 symmetries of the graph itself.
 |
 |
 |
(In these drawings, some of the edges extend "to infinity and beyond" to connect diametrally opposite pairs of vertices.) Even some smaller symmetry groups are out of reach: I couldn't find drawings with 4- or 5-dihedral symmetry, for instance. But in 3d, although it's still not possible to realize all 5040 symmetries at once (that takes six dimensions) we can get a lot closer, with a symmetry group of order 48:
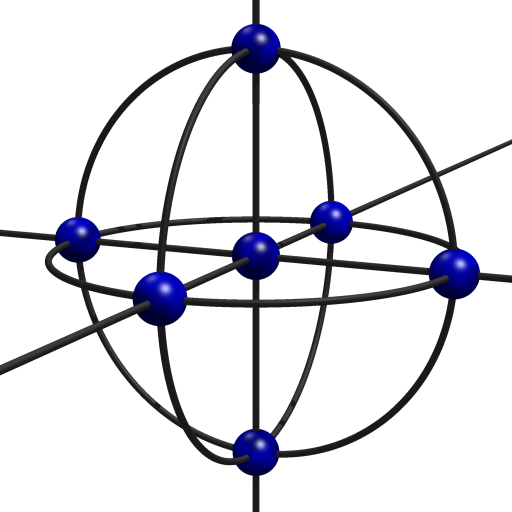
Another interesting 3d Lombardi drawing of \( K_7 \) involves tetrahedral symmetry: if one places four spheres with centers on the vertices of a regular tetrahedron, with the appropriate radius to make these spheres meet at right angles, and one can place \( K_7 \) with its vertices at the points of triple intersection of the spheres and its edges along the circles where two spheres intersect.
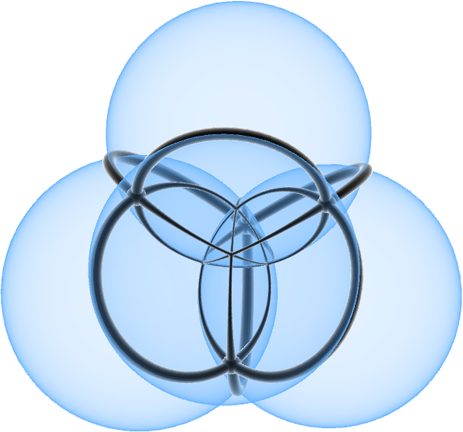
These four spheres, and the points, circular arcs, and triangular spherical patches formed by their intersections with each other, may also be interpreted as the stereographic projection of a 4-dimensional cross polytope. But the cross polytope itself has eight vertices and a 192-fold symmmetry group that is not a subgroup of the symmetries of \( K_7 \) (192 has too many factors of 2 to be a divisor of 5040). Where does the extra vertex of the cross polytope go in the drawing of \( K_7 \), and where do these extra symmetries of the cross polytope come from? The answer lies in the relation of \( K_7 \) to a different graph, the cocktail party graph K2,2,2,2, the graph of the cross polytope.
 |
 |
Some proofs in graph theory (for instance the reduction of the cycle double cover conjecture to the case of snarks) involve an operation called "splitting off" in which we pair up the edges incident to a common vertex and replace the resulting length-two paths by single edges connecting the same vertices. Splitting off can be accomplished visually in a drawing by replacing a vertex by a crossing point; when we do this to the left of the two 2d drawings of the cocktail party graph we get a messy multigraph, because the edges don't pair up the way we want them to at the crossing vertex, but when we do it to the right drawing, we get another drawing of \( K_7 \).

In exactly the same way, the 3d drawing obtained from the four sphere configuration by placing a vertex at each of the eight crossing points is a drawing of K2,2,2,2, and the 3d drawing obtained by placing a vertex at seven of these eight points and letting the eighth one remain a crossing is \( K_7 \).
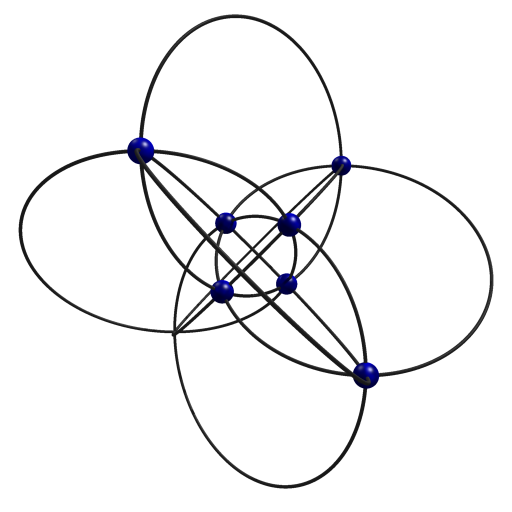
The 2d projection of this 3d drawing looks a little messy but my feeling is that interactivity (another of Peter's points) would go a long way towards making it more accessible. In fact, the 48-symmetric 3d drawing of \( K_7 \) is just a Möbius transformation of this drawing, with the crossing point hidden by being transformed to infinity. If we designate a vertex of K2,2,2,2 as the vertex to be split off, the resulting vertex-labeled graph has exactly 48 symmetries; alternatively, if we designate a three-edge matching of \( K_7 \) as representing the three crossing edges formed from this splitting-off process, the resulting edge-labeled graph again has exactly 48 symmetries. These 48 symmetries are exactly the symmetries represented by the more symmetric of our 3d drawings.
So, in sum: 3d graph drawing may be in decline, but it is not dead. It can lead to highly readable and aesthetic drawings such as the 48-symmetric drawing of \( K_7 \) when applied appropriately. Additionally, its use can lead us to serindipitous insights that we may not have been expecting when we started the drawing process, such as the splitting off connection between \( K_7 \) and K2,2,2,2. Of course, this is a lot of conclusion to pile onto some drawings of a single graph, but then so was Peter's conclusion that 3d is dead based on a single bad drawing of the same graph.
I can anticipate one possible objection here: \( K_7 \) is such a small graph that it can be drawn by hand, so what could this sort of example possibly tell us about algorithmic graph drawing and real world graphs? If it took so much care and human design choice to draw this graph, what do we need computerized drawing algorithms for? First, I think there is still plenty of scope for small graphs even in "real world" applications, both because many of the graphs actually are small and second because extracting small graphs from larger ones is an important means to getting scalable and readable visualizations. Second, to me this graph itself is a "real world" application, in the sense that it's quite representative of the graphs I usually want to draw in contexts other than graph drawing research. And third, it's not true that this graph is too small for automation to be useful: all my 2d drawings were produced by my Lombardi Spirograph program, part of the content of my art-inspired paper at GD, and would have been much more tedious to produce if they had to be drawn accurately by hand. The picture of the four spheres was also produced by Jenn, a nice prograph for stereographic projection of symmetric 4-polytopes. It's true that my other 3d drawings were produced by hand-calculation and ray-tracing rather than with the aid of any general-purpose graph drawing software, but if I knew already how to automate everything then it wouldn't be research.
Comments:
2010-09-27T06:20:59Z
A generation from now, students brought up on 3D movies will consider 3D graph drawing normal, and will probably have routine access to 3D display devices.
2010-09-27T08:40:27Z
I know very little about the topic, but as a user giving feedback I would say that the 3D graphs in this post are at least confusing. It even takes some time to see that there are 7 vertices!
Create a test on users: have number of graph drawings and ask them to identify some properties like number of vertices, etc.; and measure the time. Also ask them to tell which one is more visually appealing.
2010-09-27T15:52:13Z
There used to be quite a bit more user testing at Graph Drawing. It's not something I want to be doing myself but I think there still should be much more than there currently is. But while user testing is good for measuring how readable the information in the drawings is (e.g. as you describe one could easily measure whether a drawing makes it easy or hard to count the vertices), I don't think they're so good for measuring aesthetics — in fact the push towards measuring usability has been at the same time a push away from aesthetics as a guide to producing good drawings, and I think both are important.
2010-09-27T09:43:30Z
The reports of 3D's death are greatly exaggerated. Good post!
2010-09-27T11:44:26Z
I find it odd that at the end of this post you feel you have to justify looking at an example to try to extrapolate to behaviors or ideas you'd want to design into an algorithm. That's what scientists do!
I just mean to point out that I think many students (even beginning graduate students) don't understand that good ideas don't just fall from the sky, they're often the product of a good deal of hard work, which comes from working out and playing with many examples until the right idea comes into focus. Your post provides an excellent example of this approach.
Michael Mitzenmacher
2010-09-27T15:26:46Z
Peter asked me to add the following comments to this post:
1. I wasn´t advocating "application driven" graph drawing research. I take it that "application driven" research is where the customer writes down a list of requirements and the researcher tries to satisfy them. This kind of research is common in corporate labs and some government labs, and I´ve been involved in it, both as a manager and as a researcher, occassionally over the years. One problem with "application driven" research is (paradoxically) that it doesn´t have many applications, you tend to sove the customer´s problem but nothing more. Another problem is that the GD community is basically University based, and as such we are not well qualified for "applicaton driven" research. My talk was concerned with "application inspired" research, where the researcher looks at the customers, derives interesting problems, then solves them. Here the customers might not be in the industry; often they are people who are in some other research area. This is "extroverted research", it is quite common in Computer science departments in Universities. We also do "introverted research", where there is no external customer, and the motivation comes from the curiousity of the researcher and his community, but my talk mostly ignored this kind of research.
2. Algorithms and interaction. Any solution to the graph drawing problem involves both algorithms and systems. The graph drawing community has been very successful in designing algorithms for drawing graphs (this is what Stephen North meant when he said that GD was the big success story of info vis). I gave a keynote at InfoVis 2006 where my main point was the importance of scholarship in algorithms. The graph drawing community is very good at algorithms. At a deeper level, the skills of the GD community in combinatorial geometry are also a key ingredient to solving the graph drawing problem. My point about interaction was (a) for large graphs, interaction is the only way I know to address the graph drawing problem, and (b) the GD community, because of its skills in algorithmics and combinatorial geometry, can contribute a lot to solving problems inspired by interaction. I didn´t make any proposal that the GD community should be more systems oriented.
2010-09-28T09:44:15Z
Hi David,
your 3D drawings on this page looking amazing; which tools did you use to create them?
2010-09-28T14:56:59Z
Thanks! Just POV-Ray. Except for the four spheres one; as I wrote in the post, that was Jenn.
Sometimes when I use POV-Ray I write little Python scripts to generate all the objects, but this time there were few enough that I just did it by hand.
2010-09-28T19:13:00Z
Nice pictures! By the way, my dad makes these kinds of projections out of metal, here's the cross-polytope http://bulatov.org/metal/orthoplex_1.html
2010-09-28T20:16:42Z
Pretty. His work reminds me a bit of Bathsheba Grossman's — I have one of her bronze twisted cubes.
2010-10-22T08:16:53Z
For all those who missed it and would like to judge for themselves: the full presentation is now available from the GD 2010 Web site.
Ulrik Brandes