Graph Drawing acceptances and the Lombardi Spirograph
The list of accepted papers to Graph Drawing 2010 is out. I'm not yet sure whether abstracts will be available as well sometime soon, but I hope so.
I have several papers on the list that I'll post about in more detail once we have time to handle the reviewers' suggestions and make preprints available. What I do have ready to post today, though, is some software from one of the papers.
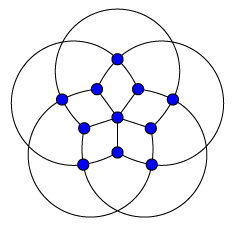
In case you haven't already seen his work, Mark Lombardi was an artist whose art consisted of graph drawings of social networks describing the connections among members of crime syndicates, international financiers, and high politicians. Unlike in a lot of other graph drawings, Lombardi's art generally depicts graph edges as curved arcs, and he obviously put a lot of care into the rhythm and spacing of the vertices. I and my co-authors were inspired by his works to define "Lombardi drawings" to have a more technical sense: drawings in which all edges are arcs of circles and in which the angles of the edges are equally spaced around each vertex. Two of our papers at GD will be on this subject.
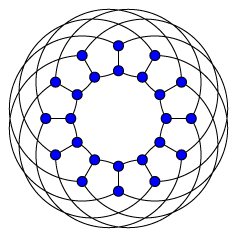
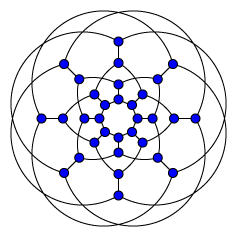
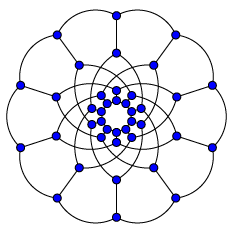
As part of our investigations into these kinds of drawings, I wrote a program, which I call the "Lombardi Spirograph", to create them, and have put it online as LombardiSpirograph.py (see the program for usage hints). It works for graphs that can be drawn with the vertices in concentric circles, with all vertices on the same circle having the same pattern of connections, which is enough to cover many of the most famous named graphs. Here are a few of its drawings, of the Grötzsch graph, Nauru graph, Dyck graph, and the 40-vertex cubic symmetric graph.
 |
 |
 |
 |