Some statistics about this year's Graph Drawing program
After two conferences I'm too tired to successfully post anything serious. So, since Graph Drawing lacks a public business meeting at which to present these, here instead are some statistics on acceptances and rejections at the conference.
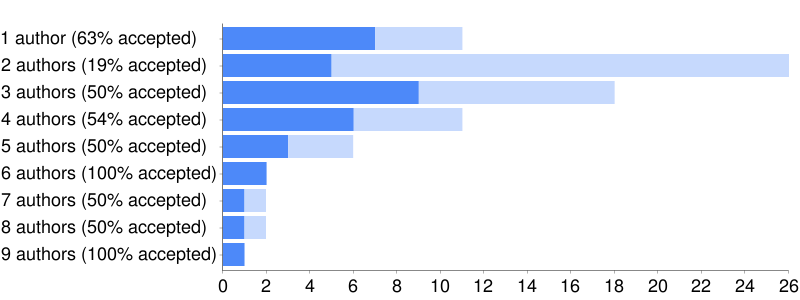
It was a bad year to have only one co-author: (Here and in the other chart below, dark blue represents accepted papers and light blue the rejected ones.)
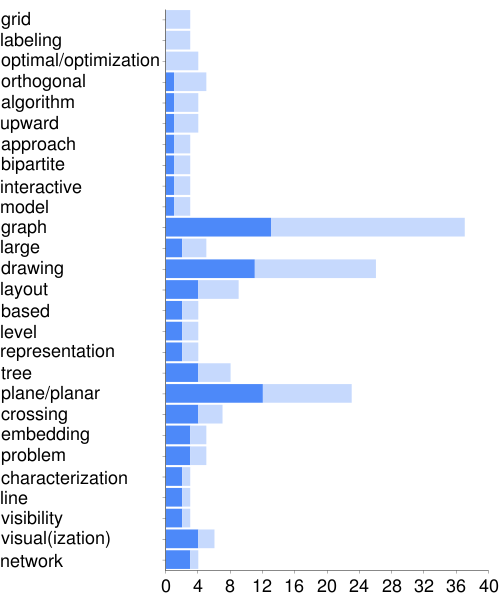
Here are the most popular title words (excluding stop words), sorted by the acceptance rate of the papers they appeared in. Somehow it pleases me that the two most frequent were "graph" and "drawing". Also, papers on optimal algorithms for orthogonal grid labeling were unusually unpopular this year.
And finally, what would Graph Drawing be without a drawing of a graph? This one has a vertex for each accepted paper and an edge between two papers that share a co-author. Somehow this looks very different from an equally sparse Erdős–Rényi random graph: the fact that it's built out of cliques (sets of papers with a common co-author) seems very visible.

Comments:
2009-09-26T08:27:46Z
papers with 9 authors?! can so many people converge to a paper at all?
2009-09-26T11:30:35Z
I don't know how it happened in this case, but often papers with this many authors come from a workshop where a group of participants got together to discuss some research problem.