Social networks are not scale-free
The following figure, stolen from A Walk in Facebook: Uniform Sampling of Users in Online Social Networks by Gjoka, Kurant, Butts, and Markopolou, tells it all, I think, but the in-depth explanation is below.
When I gave my talk on dynamic subgraph statistics at WADS, I took the opportunity to spend some time telling the audience about the exponential random graph model, a distribution on random graphs (with a fixed set of vertices) in which the log-likelihood of a graph may be computed by finding a collection of "features" in the graph (such as small subgraphs of different types, or vertices with given degrees) and adding the weights of the features. This model provides the main motivation for the data structures of my paper, since simulation of the model involves many steps of a Markov Chain Monte Carlo algorithm that each perform small changes to a graph and require the computation of updated feature counts after each change. The biggest question I got afterwards was "why don't you just use scale-free graphs"? A scale-free graph is one satisfying a power law on its degree distribution: the number of vertices with degree x should be proportional to xp for some suitable constant p. There are various methods of generating these graphs such as the preferential attachment model of Barabási and Albert or models in which every graph with a given degree distribution is equally likely as studied by Fan Chung and others.
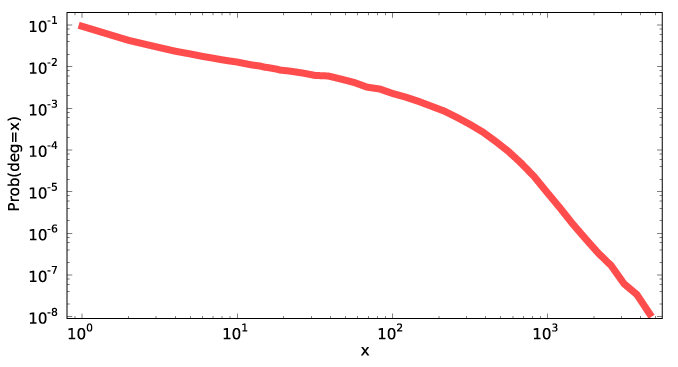
The short answer is, we don't use scale-free models because the sociologists we've been working with (including Butts, one of the authors of the paper I linked above and the advisor of my coauthor Emma Spiro) don't believe in them. First, Butts has often worked with small social networks (say, with double-digit numbers of vertices) where asymptotic notions such as power laws aren't well defined, but where some modeling is still necessary; however, that objection is less salient for the facebook graph studied in the linked paper. Second, specifying a power law on the degree distribution doesn't say much about the more detailed structure of the underlying graph (such as the tendency to form triangles by adding the third edge to a path of length two). But third and most importantly, the sociologists would be happy to use power laws if they fit the data — ERG models are capable of describing power law degree distributions very easily using the existence of a given number of vertices with a given degree as a feature, and are flexible enough to combine power laws with other structural descriptions of the graphs they generate — but there's strong evidence that many of the social networks that have been widely claimed to obey power laws don't. In particular, with a power law, the number of vertices of a given degree should form a curve that, plotted on a log-log scale, forms a straight line over many orders of magnitude, while the curve in the figure above is blatantly non-straight.
The Facebook paper is worth reading for other reasons, beyond this basic point. Its main results concern trying to sample uniformly from a large unknown implicit network for which a direct download of all nodes is disallowed or infeasible. In Facebook, the authors found a trick for performing this sampling with perfect accuracy: generate a 32-bit id, ask Facebook whether it's valid, and repeat if not. However, there's no guarantee that such methods would be available for other networks nor that they'll remain available for Facebook. Typical methods for sampling from such networks instead involve performing a breadth-first search or a random walk from a small set of seed nodes, but these methods are biased towards high-degree nodes and as the authors show they can lead to erroneous conclusions — the larger figure from which I stole the figure above compares the actual degree distribution to the distribution one might infer from one of these biased sampling methods, and shows that the two distributions are quite far apart. As the authors describe, a Metropolis-Hastings correction that is standard in other contexts (essentially, a random walk with a rule to backtrack certain steps of the walk with a backtracking probability that depends on the degrees of the endpoints of the step) can be used to sample these graphs accurately, a necessary prerequisite to statistical inference.
Comments:
2009-08-27T05:22:43Z
another relevant measurement paper (which you've most probably probably seen) is Mislove et al., IMC 2007, which has in- and out-degree distributions for livejournal, orkut, flickr and youtube (among a host of other statistics.) http://www.imconf.net/imc-2007/papers/imc170.pdf
i'm surprised the authors of this paper claim this is the first uniform sample of FB users. i've know other researchers who have a large uniform-sample FB crawl. maybe they got it from these authors. i need to check that.
2009-08-27T05:38:39Z
That must be one of the ones my colleagues were complaining about when they talked about researchers who put up plots that are clearly far from straight on a log-log scale and who then, in the face of the obvious evidence, claim that the data is consistent with a power law for the network (see Mislove et al Figure 2 and its caption).
2009-08-27T05:56:39Z
actually they seem to be rather confused about it -- they claim the distributions "show properties consistent with power law networks" (which could mean anything), but also say "however, the degree distributions in social networks differ from that of other power-law networks in several ways."
finally they present some kind of goodness-of-fit metric, which seems to show that the power law fits, but i wonder if there is a huge methodological problem here because the metric gives an equal weight to each node, and since there are vastly more low degree nodes than high degree nodes, it essentially ignores the high degree nodes.
but yeah, i agree with the overall point that the power law generally doesn't seem to fit.
2009-09-12T02:54:09Z
Actually, no we did not get it from "these authors" :). And I am very curious who are "these authors" you are referring to. There are some samples of Facebook available (like the one by Mislove at al. and also by others as mentioned in our related work section), but, to the best of my knowledge none of them have good statistical properties. Some of them are complete sets of university networks, some others are simply collected via BFS.
Can you please give a pointer of what is that you refer to?
Thanks,
Athina
2009-09-12T05:04:51Z
oh, i was thinking of the first paper on this list:http://www.cl.cam.ac.uk/~jcb82/sns_bib/main.html#crawling-and-analysis (it's a 10M node crawl.) i just went back and looked at it, and it looks like they crawl regional networks, so i guess that's not a uniform sample. alright then.
i didn't mean to day say that you got your data from someone else. that was very confused wording on my part. never mind.
2009-08-27T13:42:04Z
:) Your detailed explanation skipped over the beginning, I think. What are the axises of graph? Am I right in thinking this says that a randomly selected Facebook user will have only one Facebook friend with probability 0.1? and will have 1000 friends with probabilty 0.00001?
That's interesting. I haven't cruised random LJs in awhile, but I would have expected more of a threshold effect where I wouldn't really sign up unless I already new six or ten others. I realize that the graph here is probably greatly smoothed. It would be interesting to see how the low degrees differ from this line. I will have to check out the paper.
2009-08-27T15:52:09Z
Yes, I'm pretty sure that's what it means. The phenomenon you describe may have something to do with why the curve is flatter looking in the top left and steeper in the bottom right.
2009-08-27T22:11:13Z
i doubt the graph is smoothed. it's on a log-log scale, so you wouldn't expect things to jump around too much.
if by 'threshold effect' you mean that frequencies are not monotonically decreasing with degree, i can assure you that that's not true. not for this graph, not for any other social network.
2009-08-27T22:33:46Z
I can see it being decreasing after four or five. It surpises me there are more degree one than degree two. You'd know much better than I. :)
I have seen LJ users with only three friends. I haven't seen fewer, but I usually fall victim to the random (probably not very random at all) walkers bias. :)
2009-08-27T22:44:24Z
LJ provides a random journal feature so unbiased sampling is easy. (At least, I assume that it provides a uniformly random sample; I don't know, really.)
I just tried 10 manual samples and got a distribution for the number of friend-of links (not counting self-links) of 0, 0, 0, 0, 2, 2, 6, 8, 10, 14. No idea why I missed all the odd numbers, but that at least is consistent with the idea that there are plenty of zeroes. The zeroes I found appeared to be spambots but I don't know any principled way of removing those from consideration.
2009-08-28T01:56:36Z
My first five were 0, 0, 45, 96, 295. One of the zeros was all ads for a tire repair place. The other had no posts. Interesting. I stand corrected.