Subtraction games, the Furstenberg–Sárközy theorem, and R
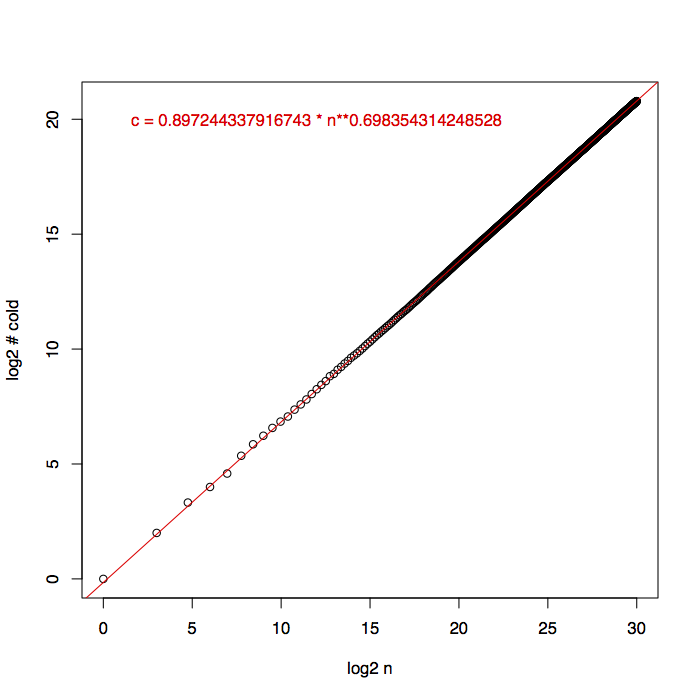
The first of my two FUN 2018 papers, “Faster Evaluation of Subtraction Games”, has now appeared on the arXiv as arXiv:1804.06515. It expands on material from two earlier posts here on the game of subtract-a-square, one of which briefly remarked that the winning positions can be calculated using convolutions in near-linear-time, and the other of which provided data hinting that the set of winning positions is an unexpectedly large square-difference-free set, something of interest to number theorists in connection with the Furstenberg–Sárközy theorem. Experimentally, if we let \(c(n)\) denote the number of winning (or “cold”) positions among the first \(n\) numbers, then \(c\approx n^{0.7}\):

In this figure, the black circles show the actual values of \(c\) up to \(n=2^{30}\), and the red line and red formula show a function that numerically fits this data, all drawn on a log-log scale. I would really like to see a proof, for some \(\epsilon>0\), either that \(c=\Omega(n^{1/2+\epsilon})\) or that \(c=O(n^{1-\epsilon})\). We know \(c=\Omega(n^{1/2})\) (because you need enough winning positions to represent every other position as a square plus a winning position) and \(c=o(n)\) by the Furstenberg–Sárközy theorem, but despite the strong numerical evidence shown in the plot above, we don’t know much more than that.
Beyond its actual content, this paper served as an excuse for me to start learning how to use the R statistical package, which is how I drew this plot and the other figures from the paper. So far, my uses of it have been pretty cookbook (i.e., search for something like what I want to do on the internet and copy the code with mild changes), but it seems pretty powerful, and useful more generally for experimental algorithmics and experimental mathematics (and of course for other topics that I’m less likely to work in).
First, you need a file of data. Tab-delimited text works fine, so you don’t need to put a lot of effort into careful output formatting. I took the sieving algorithm from my earlier posts and rewrote it in C, so it would be faster and I could reach bigger game positions without having to wait too long:
#include <stdio.h>
#define BIG (1<<30)

char hot[BIG];

int main()
{
    int n,i,r,c;
    for (n = 0; n < BIG; n++) hot[n] = 0;
    r = 1;
    c = 0;
    for (n = 0; n < BIG; n++)
    {
        if (n == r*r*r)
        {
            printf("%d\t%d\n",n,c);
            r++;
        }
        if (!hot[n])
        {
            c++;
            for (i = 1; n+i*i<BIG; i++) hot[n+i*i] = 1;
        }
    }
}
The only trick here is that to make the data set sparser my code only reports the pair \((n,c)\) (where \(c\) is the number of winning positions up to \(n\)) for values of \(n\) that are perfect cubes. I wanted to fit the resulting data set to a function of the form \(an^b\) and test what exponent \(b\) I got from the fit; I did this by transforming the data to a log-log scale and then using a line-fitting algorithm. R has several ways of fitting a line to data already coded up for me, so I chose repeated median regression, a method that is very robust against outliers (that is, it doesn’t require me to assume that the deviations from the fit line are nicely distributed). It was also easy to make a log-log plot with appropriately labeled scales, show the fit line on the plot, and throw on a label describing how that line translates into a function of \(n\):
library('mblm')
tab <- read.table('density.txt')
x <- sapply(tab[,1],log2)
y <- sapply(tab[,2],log2)
fit <- mblm(y~x)
pdf("density.pdf")
plot(x,y,xlab="log2 n", ylab="log2 # cold")
abline(fit, col="red")
text(12,20,paste(c("c = ",2**coef(fit)[1]," * n**",coef(fit)[2]),collapse=""), col="red")
I haven’t yet figured out how to get nicely formatted text with LaTeX equations for my labels, in better colors, but I’m sure it’s just a matter of time and experience. In the meantime I’ve already used R in a similar way for another research project (not yet written up) and I’m sure I’ll continue to do so for more.
(G+)