Images from Graph Drawing
Rather than make a traditional I-went-to-this-conference-and-saw-these-talks post, I thought it might be more interesting to put up a gallery of a few of the prettier images from the graph drawing proceedings, with explanations.
This first one looks like the kabbalah, but it’s actually \(K_{4,6}\), with the four vertices of one side of the bipartition in the center and the other six above and below them. It’s from “On Vertex- and Empty-Ply Proximity Drawings” by Angelini et al. (arXiv:1708.09233) and depicts a drawing with empty ply: if you cover each edge by two circles, centered at the edge endpoints with radius equal to half the edge length, then none of these circles contains any other vertices.

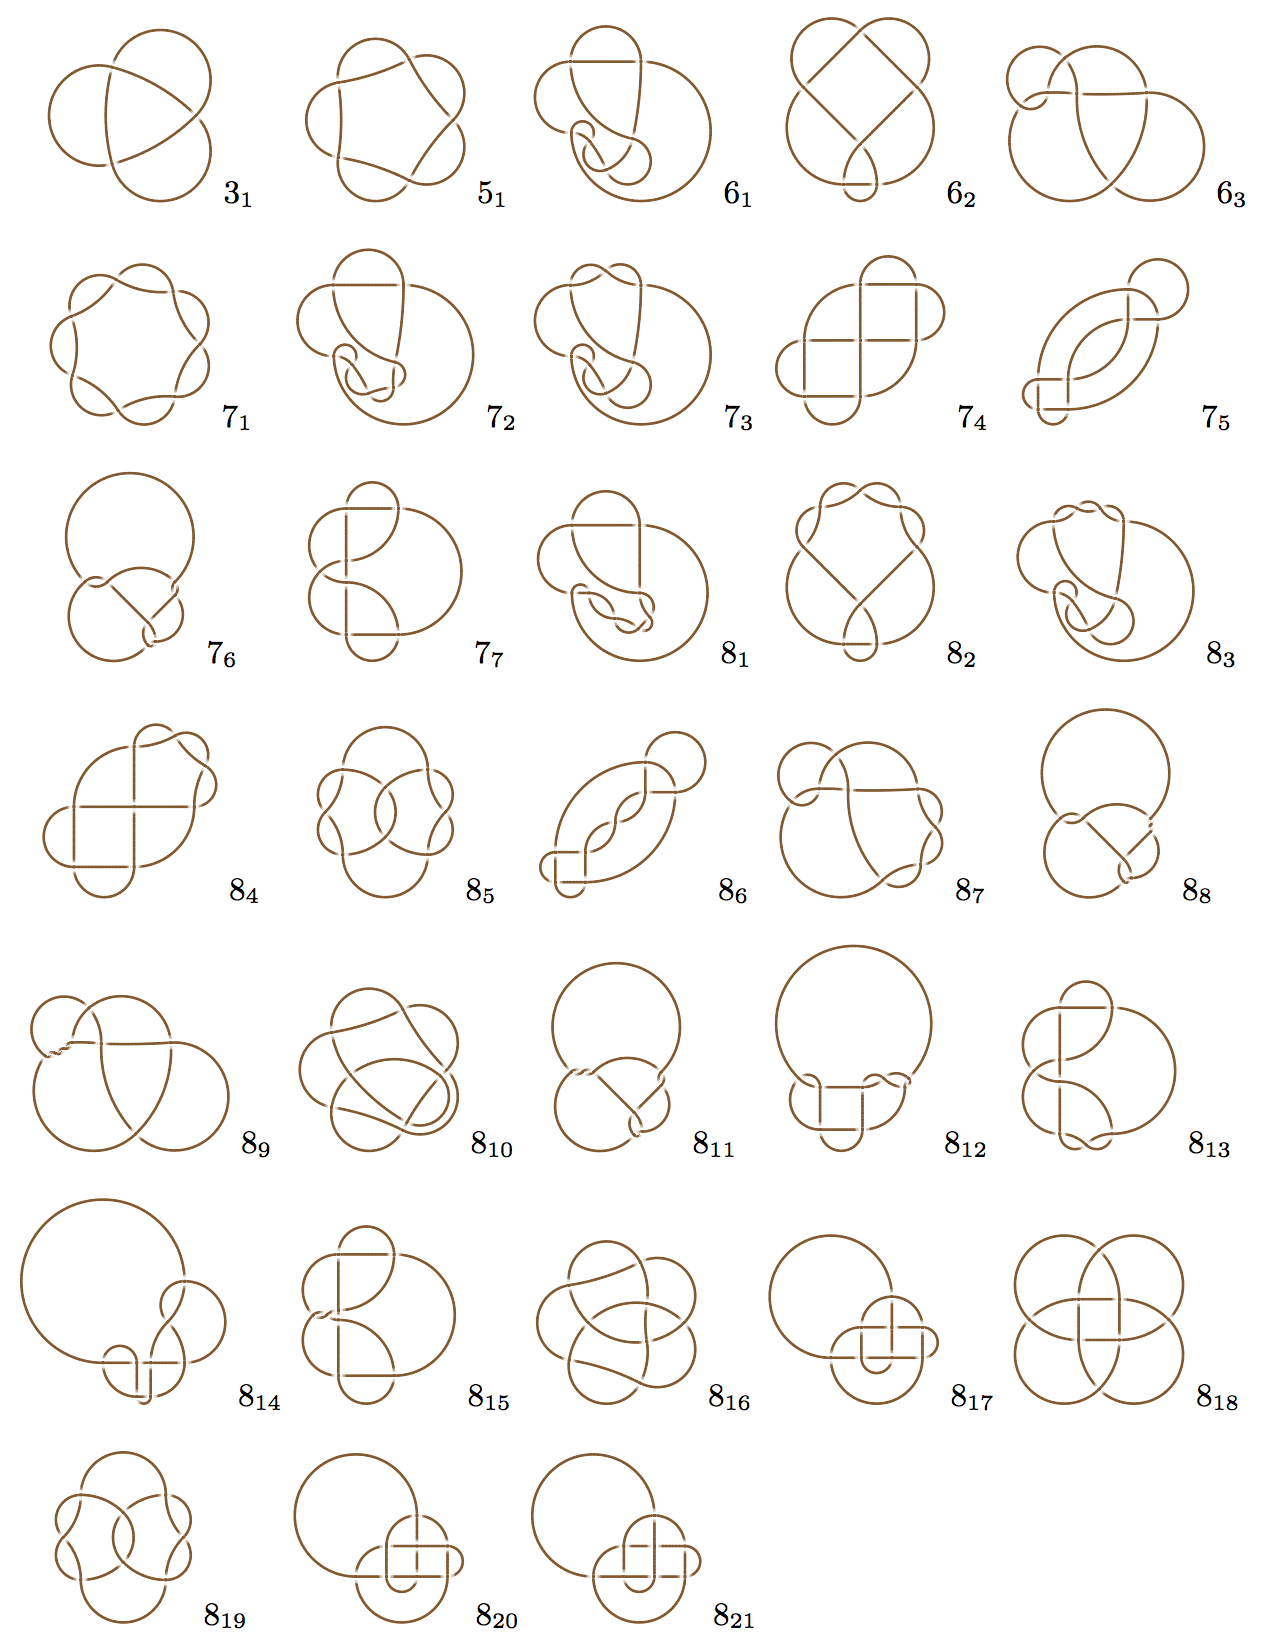
This one depicts Lombardi drawings of knots (all crossings are at right angles and all curves between crossings are circular arcs) for all the knots with eight or fewer crossings that have such drawings. It’s from “Lombardi drawings of knots and links” by Kindermann et al. (arXiv:1708.09819). Maarten Löffler’s talk on this was the runner-up for the best presentation award.
This is a friendship graph (a collection of triangles joined at a vertex), drawn as a quasi-thrackle. That means that, as in a thrackle, every two edges that don’t share an endpoint cross each other, but they can cross any odd number of times rather than only once. The central vertex \(v\) appears twice in this drawing but it would be easy to stretch one of its copies around the drawing so that it only appears once. It’s from “Thrackles: An improved upper bound” by Fulek and Pach (arXiv:1708.08037), which proves that \(n\)-vertex thrackles have at most \(1.3984n\) edges and quasi-thrackles have at most \(1.5n\) edges. The drawing shows that the quasi-thrackle bound has the best possible constant factor.

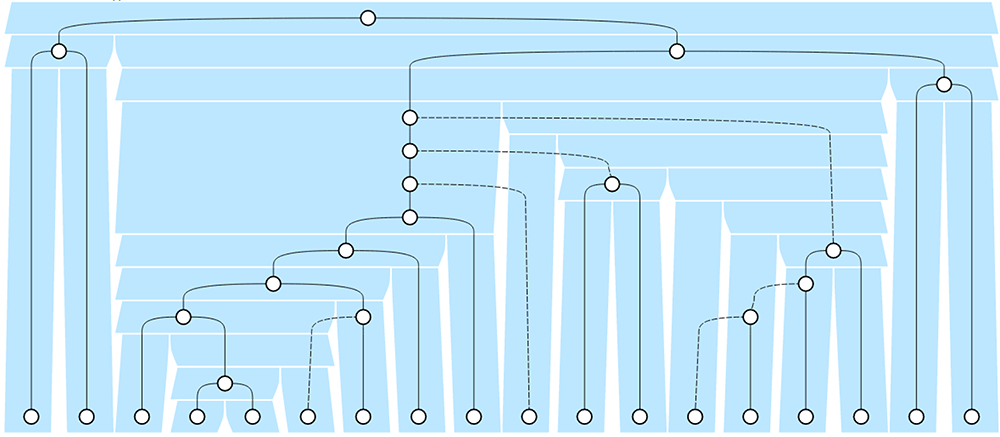
This shows two evolutionary trees, of pelicans (the light blue thick shaded tree) and their lice (the black node-link tree). Each louse has one host species that it infects, and typically those host-parasite relations are inherited (the ancestors of the parasites are ancestors of their hosts), but sometimes lice will jump sideways across the host tree from one species to another. This new visualization style is from “Visualizing co-phylogenetic reconciliations” by Calamoneri et al. (arXiv:1708.09691).
This shows another complete bipartite graph, \(K_{4,8}\), with a casing (over-under relation at each crossing) that gives only one gap per edge, from “Gap-planar Graphs” by Bae et al. (arXiv:1708.07653). An older paper of mine shows how to minimize the number of gaps per edge for a fixed drawing, but this one is about finding good drawings given only the graph. It’s also closely related to my recent paper on road crossings, which showed that crossings can be assigned to road segment in real-world road networks so that there are few assigned crossings per road segment. The difference is that this paper allows cycles of gaps (see e.g. the 4-cycles above and below the central diamond of this image) while the road network paper uses an acyclic assignment.
There were plenty of other interesting papers and results, if perhaps not with quite as eye-catching graphics, so check out the full open-access proceedings for more.