Automated drawing and optimization of syntax diagrams
If you've ever written a computer program you probably learned a little bit about context-free grammars, a formal method of describing the syntax of most programming languages that can be turned automatically into code for parsing those languages through the magic of compiler-compilers such as yacc. They're used for most other kinds of formal language, too: see for instance the JSON home page, which includes a grammar describing the syntax of data-description language JSON.
Go look again at the JSON page more carefully, and you'll notice that there are actually two different descriptions of the same context-free language. In a sidebar on the right of the page is a context-free grammar, a textual description of the JSON language. But more prominently, to the left of the grammar, are a bunch of diagrams that look like railroad tracks, called syntax diagrams. You can generate any string in the language by starting at the left terminal of the object track, following any smooth path in the track until you get to the right terminal, copying down the train stations you passed through on your way, and then expanding out the rectangular ones in the same way recursively. This idea of following smooth paths in a railway-like diagram has been floating around in graph drawing under the name of "confluent drawings" for a few years, but it's been used in syntax diagrams for much longer. It's really a generative model rather than a discriminative model, in that it tells you how to form all possible strings in the formal language but it doesn't tell you how to parse a string; nevertheless, it carries the same basic information as the grammar.
Or does it? Look a third time at the JSON page, and you might notice that the syntax diagram does not reflect the exact structure of the grammar. For instance, the grammar says that there should be only two smooth paths through the "object" track: one that passes through the two train stations "{" and "}", and a second one that passes through the "members" station between these two. But the diagram has a looped section of track that allows you to form infinitely many smoothed paths! They both describe the same language, but not in the same way. And this is a clue that the diagram must have been drawn by hand, or possibly drawn from a different grammar, because all the software I can find on the net for drawing syntax diagrams only performs a direct translation of a grammar to a diagram.
So this is where my new preprint, Confluent Orthogonal Drawings of Syntax Diagrams (arXiv:1509.00818, with Michael Bannister and David Brown, to appear at Graph Drawing) comes in. We take the point of view that writing grammars to be parsed automatically (essentially, a discriminative view of formal languages) and drawing syntax diagrams to visualize the strings that belong to the formal language (a generative view) are two different things, and that one can perform optimizations while going from one to the other (as the JSON people did) to make the syntax diagram easier to understand. Our paper envisions a third, intermediate description of a formal language (like the train station between the two brackets) that is abstract enough to allow these sorts of optimizations while also being flexible enough to describe more train tracks than the series-parallel ones that one gets from direct translations of grammars.
In this third description, a formal language is described as a set of nondeterministic finite automata, one for each of the tracks of a diagram or for each of the nonterminals of a grammar. However, unlike the usual form of NFAs that can only recognize regular languages, the ones we use have alphabets that include both terminals and nonterminals. You can use these to generate strings in the formal language in the same way that you would with syntax diagrams: generate a string in the language by following a path from start to accept state of the initial NFA but then recursively do the same thing to expand each nonterminal in the string.
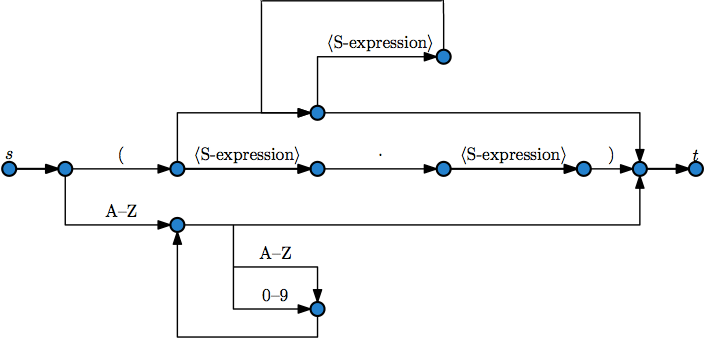
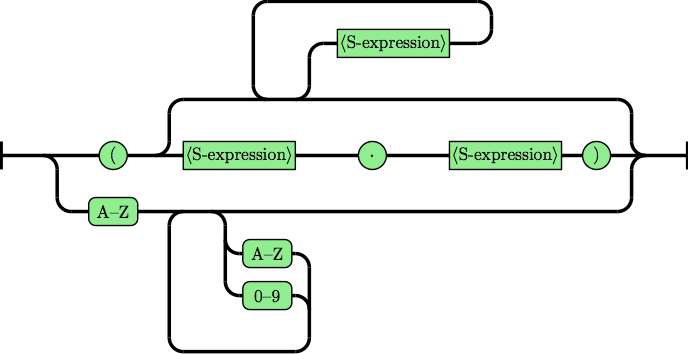
An NFA is just a special kind of graph, and if we apply standard graph drawing techniques to this graph we get something that resembles a syntax diagram. But not quite: what look like vertices in the syntax diagram (its train stations) are actually not vertices, but edges, in the NFA. And the parts of the syntax diagram where the parts of the track come together, that look like confluent junctions of multiple edges in a confluent graph drawing, are actually not junctions, but vertices, in the NFA. So with a little care in the layout and a little transformation of how we draw each kind of object, we can turn our graph into a diagram. For instance this NFA (optimized from a grammar for LISP 1.5 and drawn with some edges overlapping each other so that it looks confluent but isn't really):
turns into this syntax diagram:
With this representation in hand, we can go about optimizing the diagram to improve the visualization. There are a lot of things we could have tried, but in this paper the main ones are local optimizations to individual diagrams (such as pulling together tracks that go to the same place), replacement of tail-recursive calls of a diagram within itself to create loops, and replacement of nonterminals in one diagram by copies of the corresponding diagram, to reduce the number of different components in the visualization at the expense of making individual components more complicated.
The paper also contains some experimental testing to show that these optimizations are effective, but I don't think that's really the point. The real point of the paper is to introduce the idea of algorithmically improving the appearance of syntax diagrams, rather than translating grammars directly to diagrams, and to provide both a software pipeline and an intermediate data structure that make that improvement possible.
Unfortunately, although (unlike many of my papers) we implemented what we wrote about, I don't think our actual code is in good shape for public release. And my co-author who wrote all the code (David Brown, an undergraduate at the time) has graduated and gone on to better things. But now that we've done this research and understand better what we should have been doing in the first place, I think a second system built along the same principles would work much more smoothly and could be a very helpful visualization utility.
Comments:
2015-09-04T06:07:22Z
Cool! I hope someone reads the preprint/published version and tries to implement it themselves. (When I'm not so busy, I'll try to see if it's something within my abilities!) It would be a really cool utility.