Why your lovers had more lovers than you did
Friendship paradox on Wikipedia: the strange-but-true fact that in a social network (or any graph that is not regular), the average degree of a node is always smaller than the average degree of a neighbor of a node.
I'm a bit unsatisfied by the mathematical formulation of the problem, though. I don't want to compare the average degree of a random node x with the average degree of a neighbor of a different random node y, and neither do most of the people writing commentary about this. What I and they actually want to know is how likely it is that x has smaller degree than the average of its own neighbors' degrees. And as the example of a complete graph minus an edge shows, this can actually be quite unlikely. So what is it about social networks that makes the complete-minus-edge example so atypical? Don't say "assortive mixing", I want an answer in terms of graph-theoretic properties.
Comments:
2011-08-21T02:48:36Z
An interesting observation is that this property also fails to hold for graphs near the limit of unconnectedness, too -- if all of your nodes have either zero or one neighbors, then (for the nodes that have neighbors) the average of their neighbors is equal to their own.
On the other hand, that's a case of exactly not holding, and as soon as you include some triplets as well as pairs, the property holds.
2011-08-21T08:17:30Z
And, tracing down the hunch that came from that: Yeah, this isn't because of assortativity. I wrote a little program that created random graphs by iterating over all the possible edges for a set of nodes and creating the edge with probability p and then compared the degree of each node to the average degree of its neighbors. Here's the resulting plot, for graphs of 100 nodes for a range of probabilities from 0 to 1. The horizontal axis is probability of any given pair of nodes being connected by an edge, and the vertical axis is the ratio of nodes that have lower degree than the average degree of their neighbors, to the sum of those that are lower and those that are higher (ignoring the ones that are equal). Each point on the graph represents an average of 10000 random graphs, and the dotted lines are at plus and minus one standard deviation.
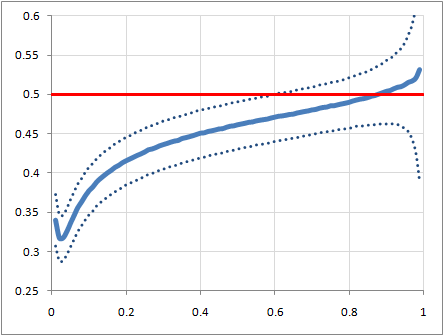
There's a clear crossover point a bit above a probability of 0.8, but below that the skew is quite conclusively towards nodes having lower degree than the average of their neighbors' degrees.
(Source code is graphs.cpp, if you want to play further.)
2011-08-21T09:26:23Z
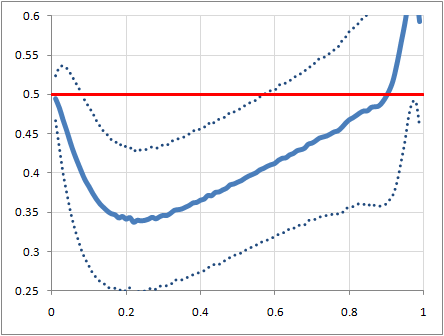
I was curious how this differed for differing graph sizes, so here are some examples of that. First, for graphs with 10 nodes -- although the data towards the ends of the plot are fairly bogus, as most of the graphs there have all their nodes with the same degree, and so the arbitrary value of 0.5 that I used to avoid a divide-by-zero in that case dominates the data:
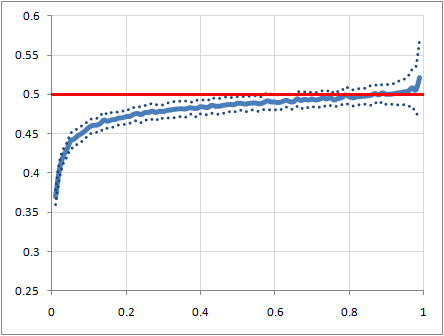
And a plot for graphs with 1000 nodes:
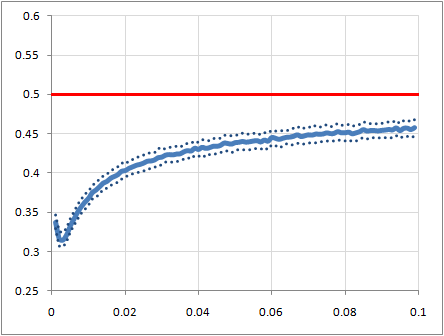
The low-p end of that looks interesting, so here's a closeup of it:
Interestingly, it looks like both the crossover point (in terms of p) and the minimum ratio are remarkably constant across a wide range of graph sizes, although the location of the minimum ratio seems to be based on the average absolute degree of a node rather than p. In fact, the whole left end of the plot is reaching a uniform shape in terms of average degree of a node, which makes intuitive sense.
Also, I am noticing that the point of minimum ratio is quite close to what I'd guess is the average number of lovers or really close friends that a person has.
2011-08-21T16:26:57Z
So the regions where the blue line is below the red are the ones where most vertices have lower degree than the average of their neighbors?
It surprises me a bit that you would get such a clear bias even for purely random graphs (say p=0.5). Because these graphs are so close to regular that it would be easy to think that this is just a "reversion to the mean" phenomenon where vertices with lower-than-average degree have fewer neighbors than neighbors-of-neighbors and vertices with higher-than-average degree have more neighbors than neighbors-of-neighbors. But in this case the degree distribution is very nearly Gaussian so equal numbers of vertices should be below and above the average (i.e. the median degree and average degree are pretty much the same). Even in this case, something else is going on.
But, purely random graphs are too uniform and structureless to make accurate models of social networks.
2011-08-21T17:39:05Z
Yes, that's exactly the meaning of the lines. (The difference between the lines shows the ratio of "lower-degree" and "higher-degree" nodes, and is not related to how far off of equal they are.)
I agree that purely random graphs are far too uniform to be accurate. I suppose I'm coming at this from an engineer's perspective: First assume a perfectly spherical social network, and see if you can explain the phenomenon with that.
I wonder if this is simply a variant of the probability paradoxes like Bertrand's box paradox; in selecting the neighbors and non-neighbors of a given node, we are biasing the selection towards those with a shared edge with the given node.
Elaborating on that: suppose that we take a random graph with N nodes and edge-probability P, and an unconnected node. The expected degree of nodes in the graph is (N-1)*P. If we connect the new node to the graph with the same edge probability, it will have an expected degree of N*P. However, the expected average degree of the nodes that it connects to will initially be (N-1)*P because they are randomly selected from the existing graph, and thus will be (N-1)*P + 1 once we add the new edge. Factoring that, we have N*P + (1-P) as the expected average degree of the new node's neighbors, which is clearly greater than N*P.
2011-08-21T18:42:39Z
Further experimental evidence for this: Looking at a large number of 100-node random graphs with p=0.5, the expected degree of a node is 49.5 (with standard deviation around 5.0), and the expected average degree of a node's neighbors is 50.0 (with standard deviation around 0.85) -- and the latter is, of course, essentially independent of the degree of the node itself because the graphs are random.
2011-08-21T03:30:39Z
It's all about assortativity. Some networks are mostly assortative, and some are mostly dissortative.
2011-08-22T20:20:07Z
Well, but if networks that are assortative and networks that are dissortative and networks that are neither all display the same phenomenon, then assortativity can't be the explanation, can it?
2011-08-22T21:38:48Z
But the point is that they don't. In a dissortative network, you friend has more or fewer friends than you do (which on average makes sense). In an assortative network, your friends on average have about the same number of friends (which, again, makes sense).
2011-08-22T22:16:33Z
But in social networks, there are many more low degree vertices than high degree vertices. So in a dissortative network (in which the low degree ones tend to be connected to high degree ones and vice versa) it is much more likely that a random node is one of the low degree ones and is connected to high degree ones than vice versa. So dissortative networks are not an exception to the paradox. In assortative networks, too, the point is that the friends on average have *slightly more* friends, not "about the same" as you said.
2011-08-22T22:29:46Z
I somewhat agree about dissortative networks, but the assortative case still looks paradoxial - and thus not convincing.
2011-08-21T05:49:05Z
Very interesting. It reminds me of a similar "phenomenon" that friend used to tell me all the time: life is a submartingale, the outcome is always less than expected....
2011-08-21T09:02:41Z
Reminds me of "life is like the game from the St Petersburg paradox: it's value is infinite, but no matter what you do, you'll waste it."
2011-08-21T09:21:13Z
Perhaps the following would be a better model than a random graph. Each node i has a probability p_i, that describe how social they are, and now i and j is connected with probability p_ip_j. Then your friend will often be more social (on average) than you, and that would give a larger effect than on a random graph.
A more realistic model would be to use a vector instead of p_i, where each index is how often the node i is in place or among a certain group of people. Then the probability of a connection between i and j should be 1-\prod_k (1-p_{ik}p_{jk}).
2011-08-21T10:06:47Z
My graph theory knowledge is elementary and all my terminology was in Greek, but here we go:
Assortivity is close, but not good enough to explain this. The reason why it's difficult to model this situation is because different people use social networks for different uses. For example, we have famous people who work as a kind of hub or backbone network: They are usually interconnected and they have a lot of followers/friends with low degree.
Then, they are tight-knit communities who form cliques. Note that the usual case is that a vertex belongs to half a dozen cliques, maybe more.
As for why your example is atypical, I will go a step further: It is impossible, yet the reason have nothing to do with graph theory. Simply put, if you are in a community of N people and you share N-1 friends with somebody, it follows that eventually one of the following will be true:
a) You will become friends with the Nth person, thus completing the graph.
b) You will become "enemies" with the Nth person, which given some time will completely change the structure of the graph to two loosely connected pieces, in the best case.
Most student relationships would probably confirm my hypothesis, as those who went to school might notice.
2011-08-22T02:40:07Z
I suggest the reason the average degree of a vertex's neighbors is larger than its degree is because of the heavy tailed-ness of the nodes' degree-distribution. Such distribution have the property that the mean is greater than the median.
If we consider the degrees of the a vertex's neighbors as samples from the degree distribution then the average of those is an approximation of the mean of the degree-distribution. Most vertices have degrees of median degree or less (by definition of median), and therefore since the median is less than the mean, most vertices' degree is less than said approximation of the mean of the degree-distribution.
The example discussed in the post, has the mean less than the median, and therefore the argument above does not follow through. Specifically, for n-vertex complete graph with 1 edge removed, the average degree is n-1-2/n, and the median degree is n-1 (for n > 3).
Using average neighbor degree as an approximation of the mean is a heuristic. In assortative graphs the situation is even better, since higher degree nodes tend to use the higher part of the distribution. This would tend to increase the popularity of the good event (degree less than average of neighbors) even more.
Of course, this is a heuristic explanation but it has a convincing ring to it, I hope.