Crown graph drawing tutorial
In the comments to a recent posting, the question “how do I make my drawings” came up again, so I thought I would put together a tutorial describing how I made one of my drawings, a new illustration for a Wikipedia article on crown graphs (complete bipartite graphs minus a matching, which I also discussed in this earlier post in the context of covering these graphs by bicliques).
I've made lots of screenshots, but they're big, so I'm linking to them here rather than including them directly as images.
The first question to be decided was how to arrange the vertices and edges of the graphs. After a couple of false starts involving adding extra vertices to a cube (e.g. the ten-vertex crown graph is a cube together with two extra vertices, each attached to four cube vertices) or pairs of nested polygons, and after rejecting the tangled two-parallel-column layout of MathWorld, I settled on a circulant layout in which the graphs are drawn as regular polygons with interior diagonals. This would allow me to draw several crown graphs side by side, better showing the similarities from one to another, and would depict some of the high level of symmetry of these graphs. It didn't occur to me until long after I'd made the drawing, but this style also shows the Hamiltonian cycle structure in these graphs, important for one of their applications. I also decided at this time to draw the vertices in alternating colors to show the bipartiteness of the graphs because (unlike the MathWorld layout) the layout itself doesn't make the bipartite structure clear without that kind of help. Ready to begin, I opened Adobe Illustrator, and created a new document with default proportions, in landscape mode to match the intended side-by-side placement of the graphs. In order to get the drawings to line up neatly with each other I turned on the grid (cmd-quote) and grid snapping (cmd-shift-quote).
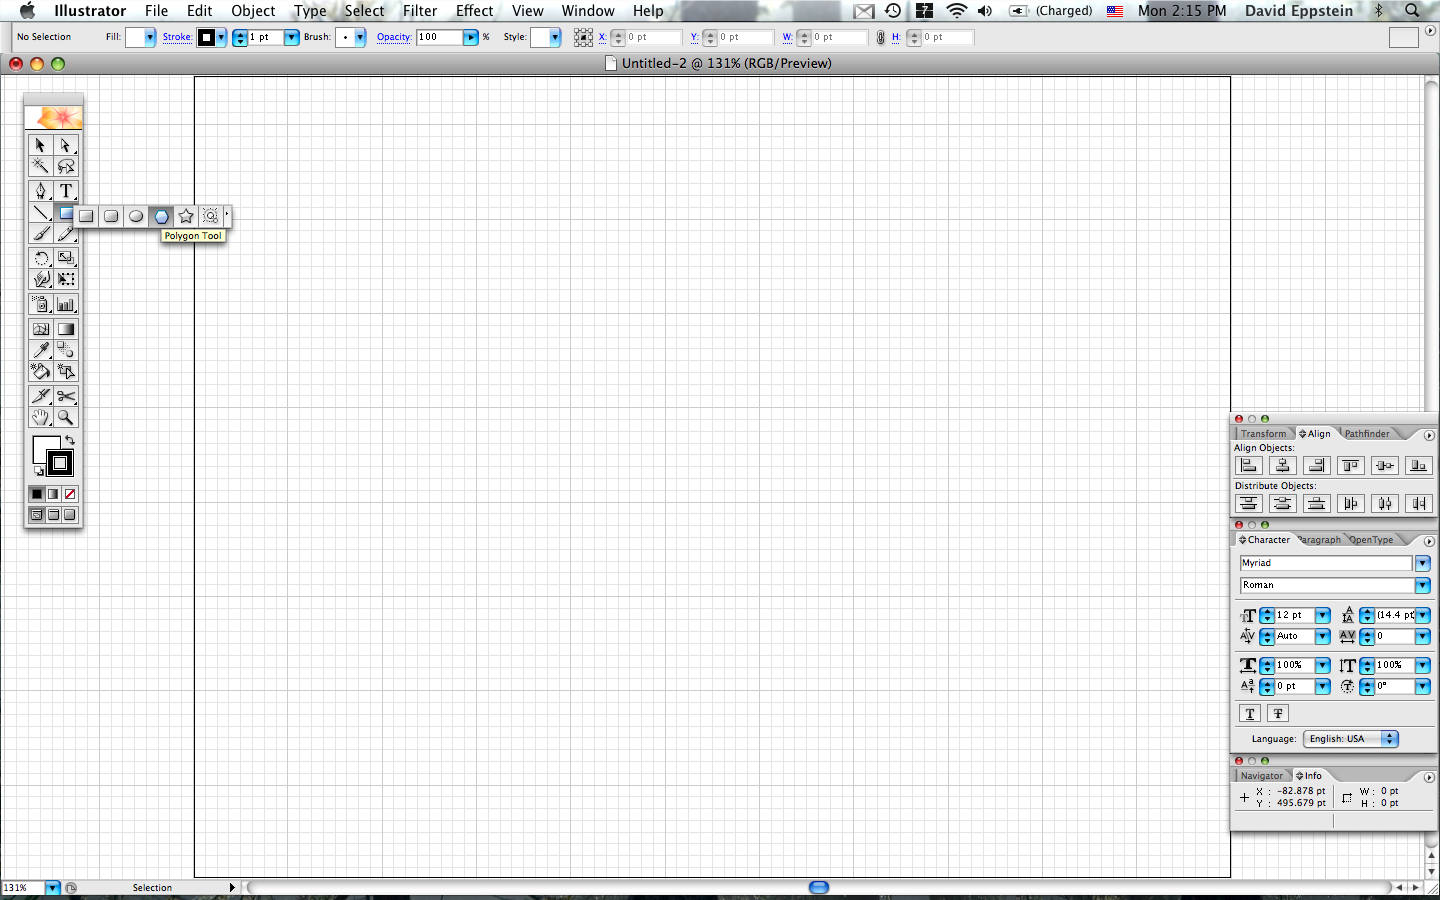
Next, I created the regular polygons that formed the outer boundaries of each graph. Illustrator has a regular polygon tool, which lies under the rectangle in the tool bar.
To use the polygon tool, option-click on where you want the center of the polygon to be (I picked the intersection points of some of the heavier grid lines) and fill in the details of how big to make the polygon. I chose a radius of 108 points because I knew that Adobe's grid works in multiples of 9 points, but for this particular drawing the precise radius doesn't really matter. It's also possible to click on a center and, while holding the mouse down, drag out the radius, but I wanted to use the text interface to make all three polygons the same size.
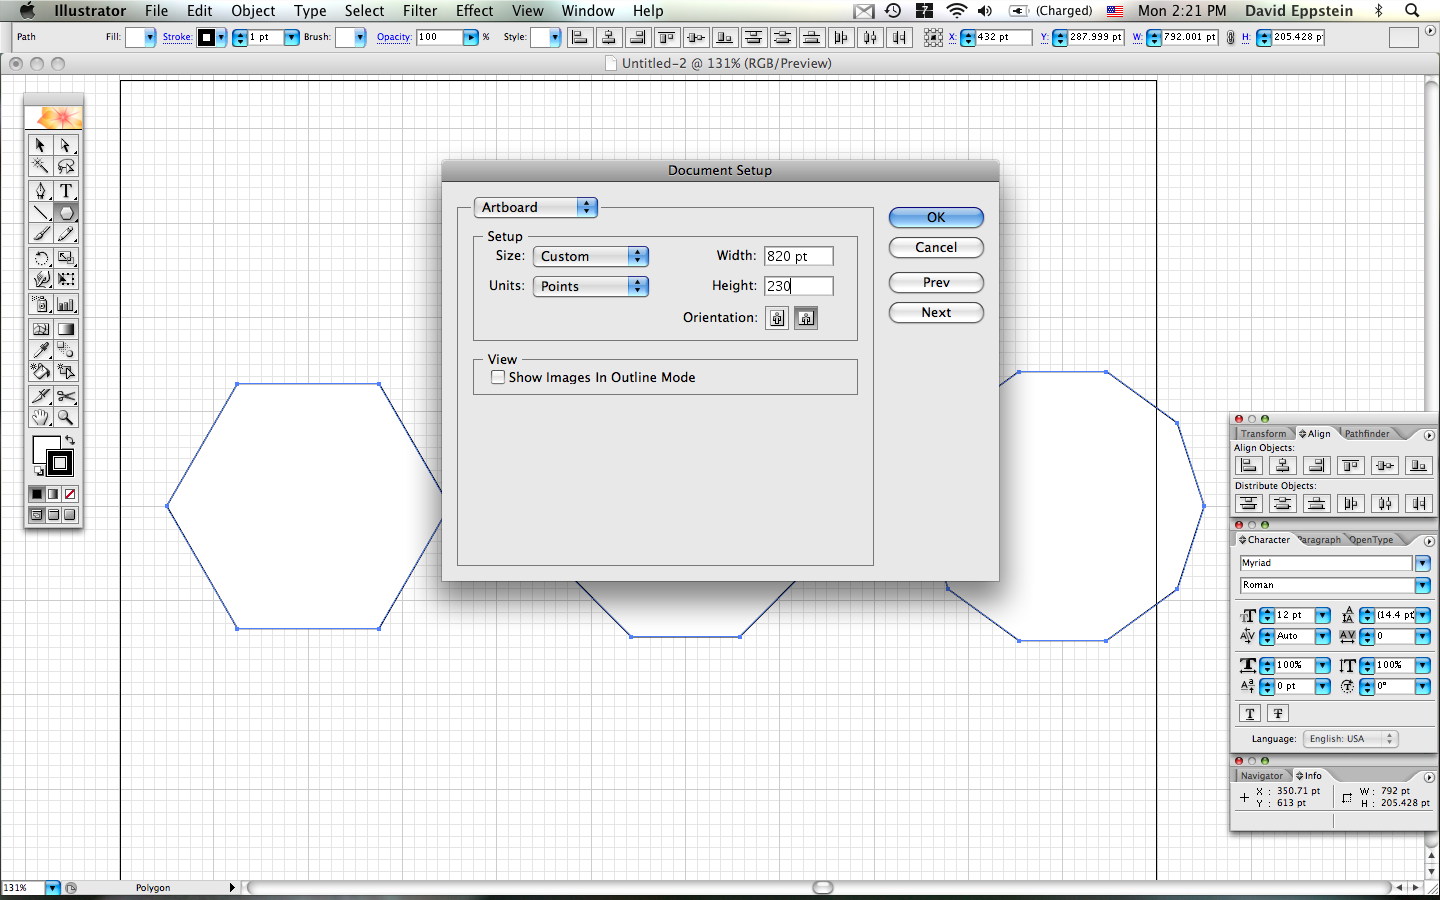
With all three polygons drawn, select them all (command-A), and look in the "info" pane (bottom right corner of my screen) for the size of their bounding box. Use the File->Document Setup command to make the size of the drawing board match the size of the image; I usually save this until last but in this case the initial drawing board's boundaries were crossing into where I wanted to draw. I added about 30 pixels to both dimensions to account for the fact that the vertices would extend past the polygon edges a little bit. Resizing like this isn't always necessary (when I'm producing svg files, as for Wikipedia, the file ends up having the bounding box of the drawing as its dimensions without me having to do any work, and sometimes I add an invisible rectangle to the drawing to control this bounding box) but my installation of pdftex needs images with good bounding boxes so this is just something I do as a default nowadays.
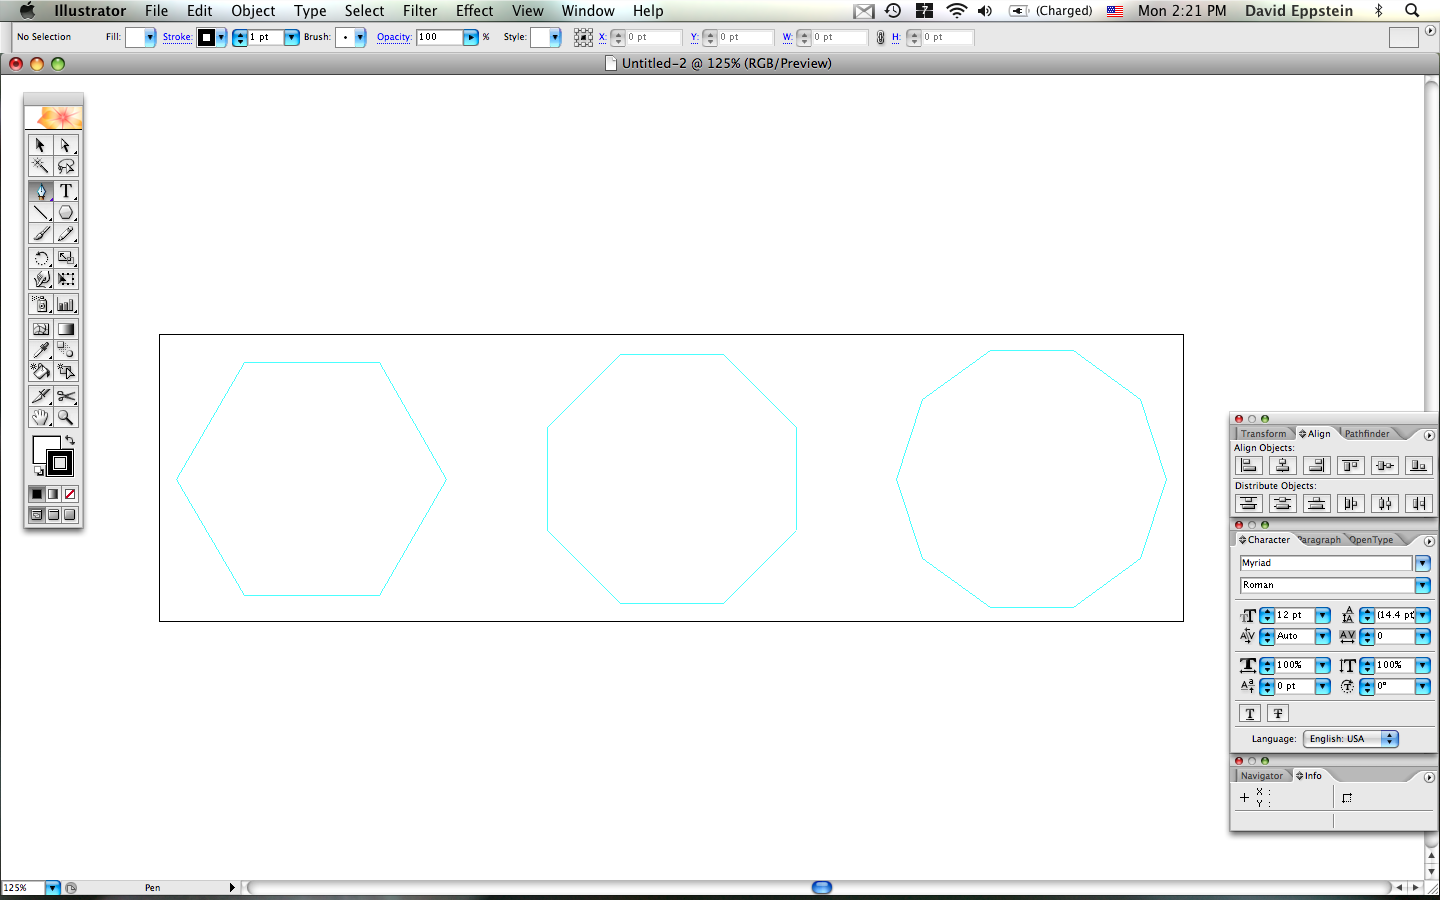
Once the drawing area is resized, it's possible to center the content in the drawing area by selecting everything, deleting it (command-delete), centering the drawing board on the screen (command-0), and pasting everything back on (command-V). At this point, I also disabled the grid (command-quote command-shift-quote) and turned the polygons into guides (shown as light blue lines in Illustrator; clicking nearby will cause the mouse to snap to the features of the guides). To turn them into guides, use command-5.
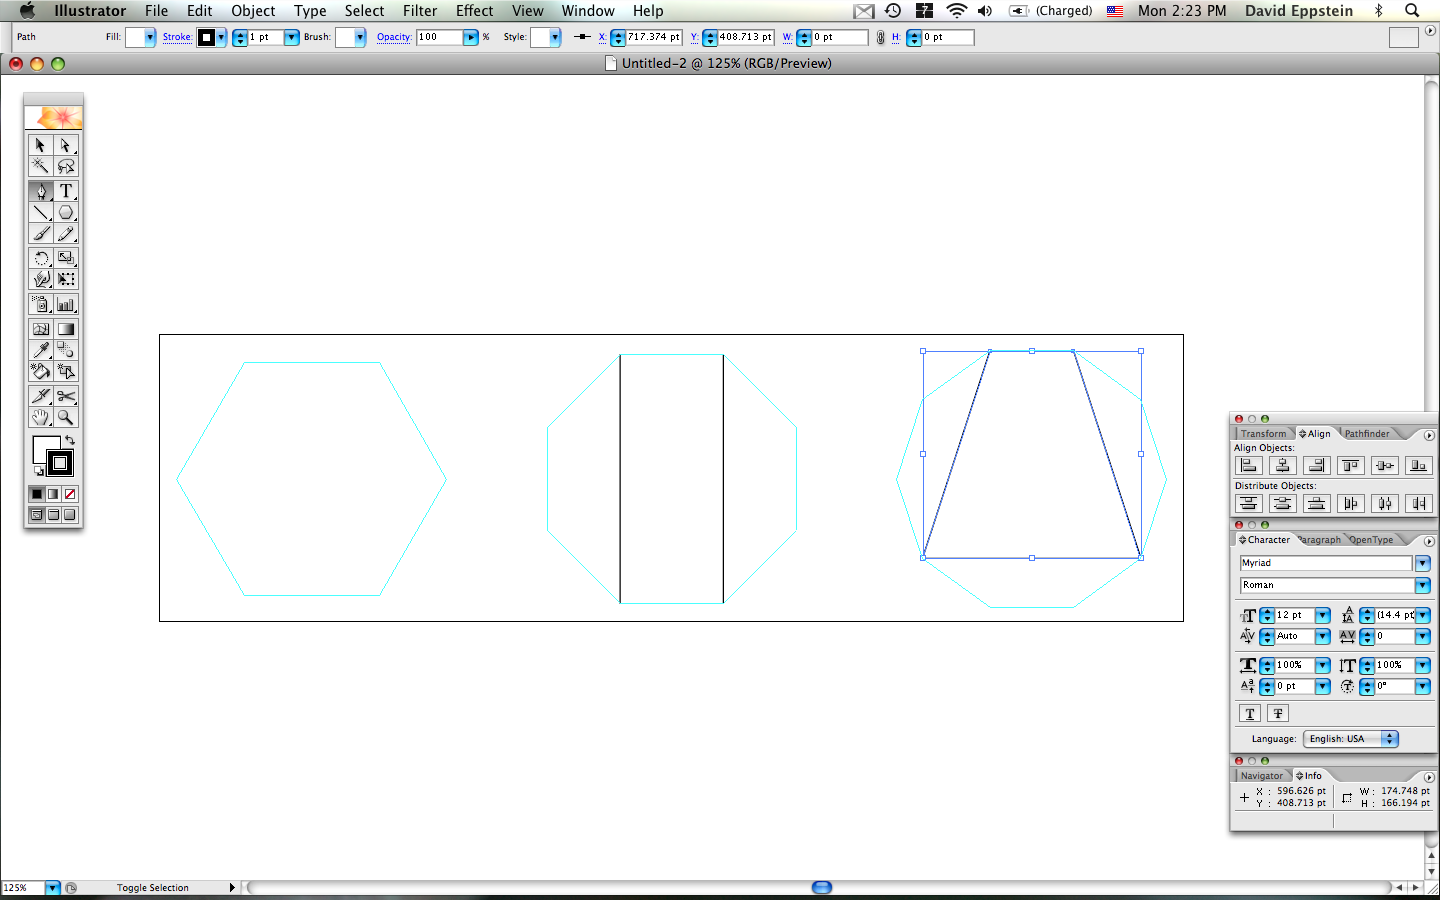
Next, I selected the pen tool (the "P" key without any modifiers selects the tool) and started drawing the remaining graph edges. Click on a guide vertex to start an edge, click on the next vertex to continue a sequence of edges, command-click on any empty part of the drawing to stop the sequence and allow a new sequence to be started.
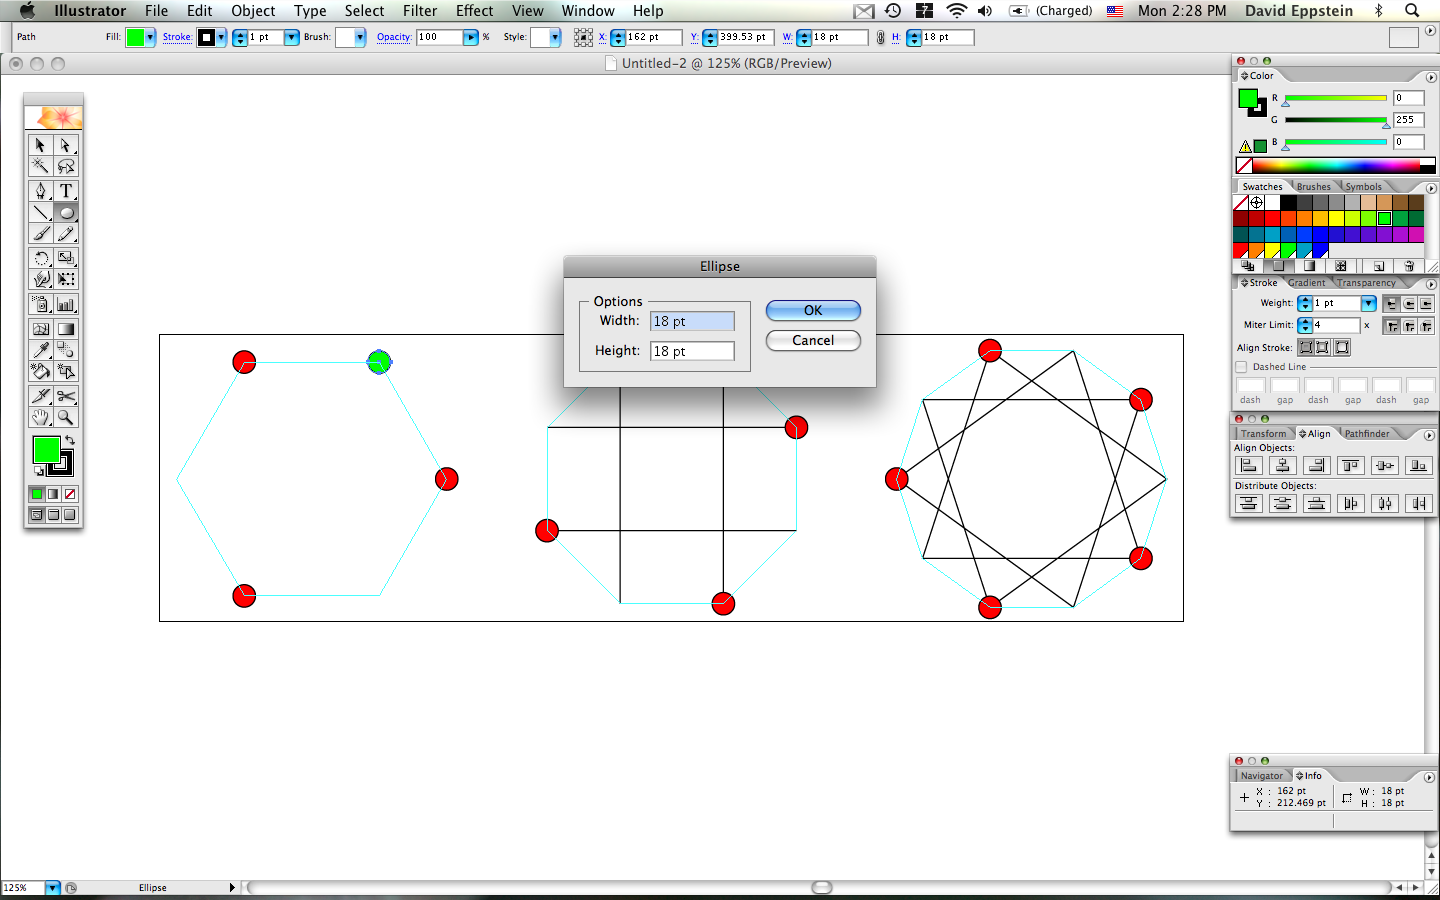
With all the edges drawn, it's time to begin drawing vertices. I selected the ellipse tool (the "L" key), and used the color palette to select a fill color for the vertices. In this case I chose red, one of the first colors I usually go to because of the bold look it creates. Then I started creating vertices by option-clicking on each guide corner and selecting a radius for the resulting circles.
For some drawings I create only a few of the features and then replicate them according to the symmetries of the drawing using the rotate tool, but this time I created each vertex individually. Once the red vertices were drawn, I selected a constrasting color (green, again very vibrant and also contrasting with the red by being quite a bit lighter) and drew the remaining vertices the same way.
All the features are drawn, but the guide edges won't show up when the image is saved. Unlock the guides (there's a command key for this one but I don't usually remember it and use the menus instead), select all (command-A), and release the guides turning them back into normal polygons (command key or menus).
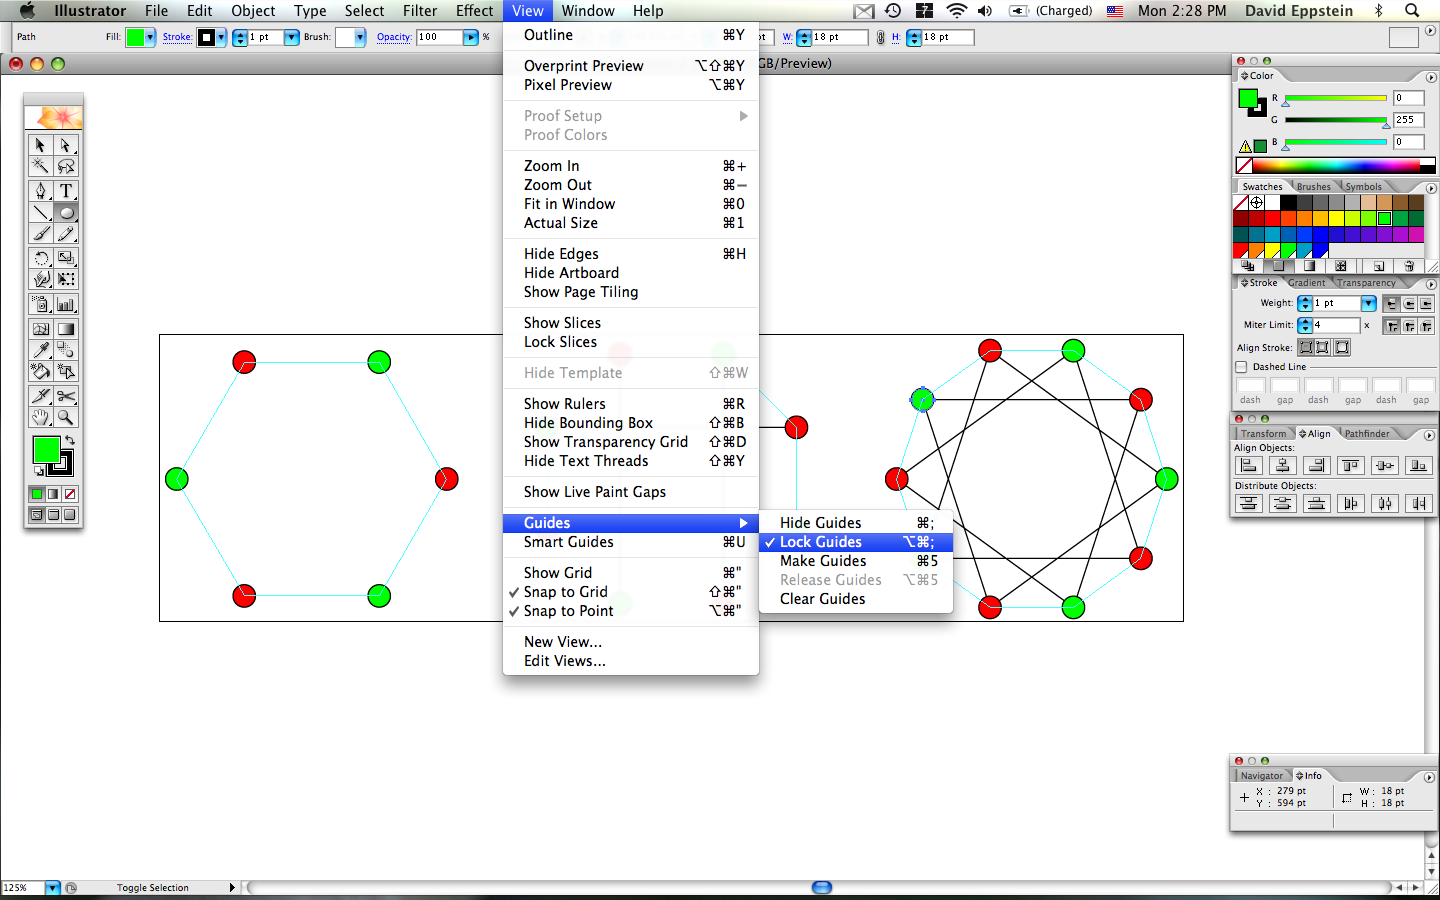
The resulting drawing is complete, but still a little ugly because it uses the default coloring for the edges. The polygons should still be selected; to include all the other edges into the selection, so that their drawing attributes can be modified, use Illustrator's Select->Same->Fill & Stroke command.
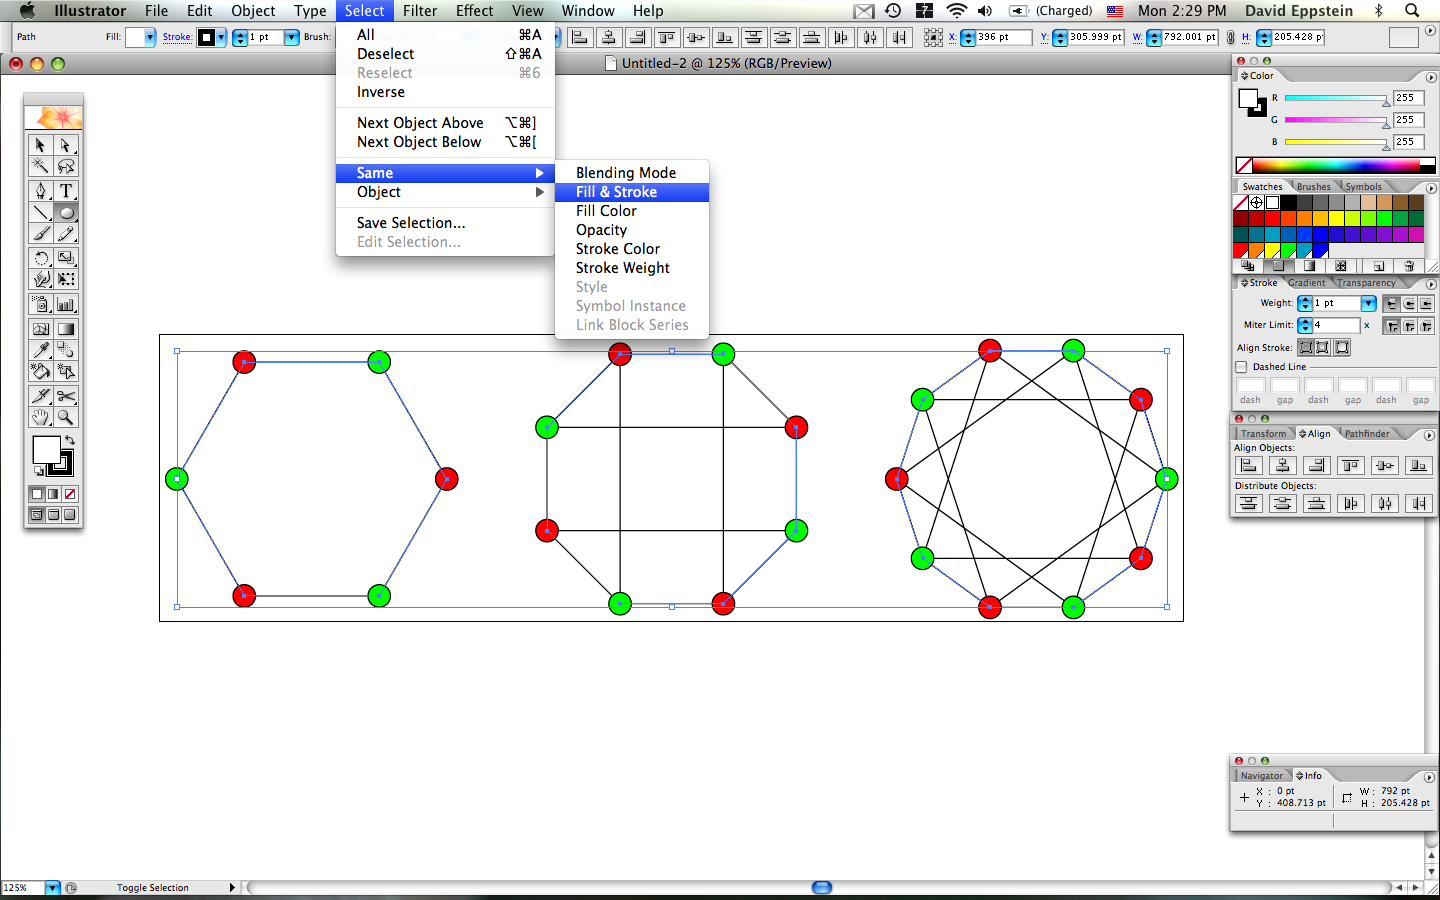
Using the stroke palette to make the edges thicker, turning off their fill color, and playing with the RGB sliders to get a bluish gray stroke color finishes the drawing!
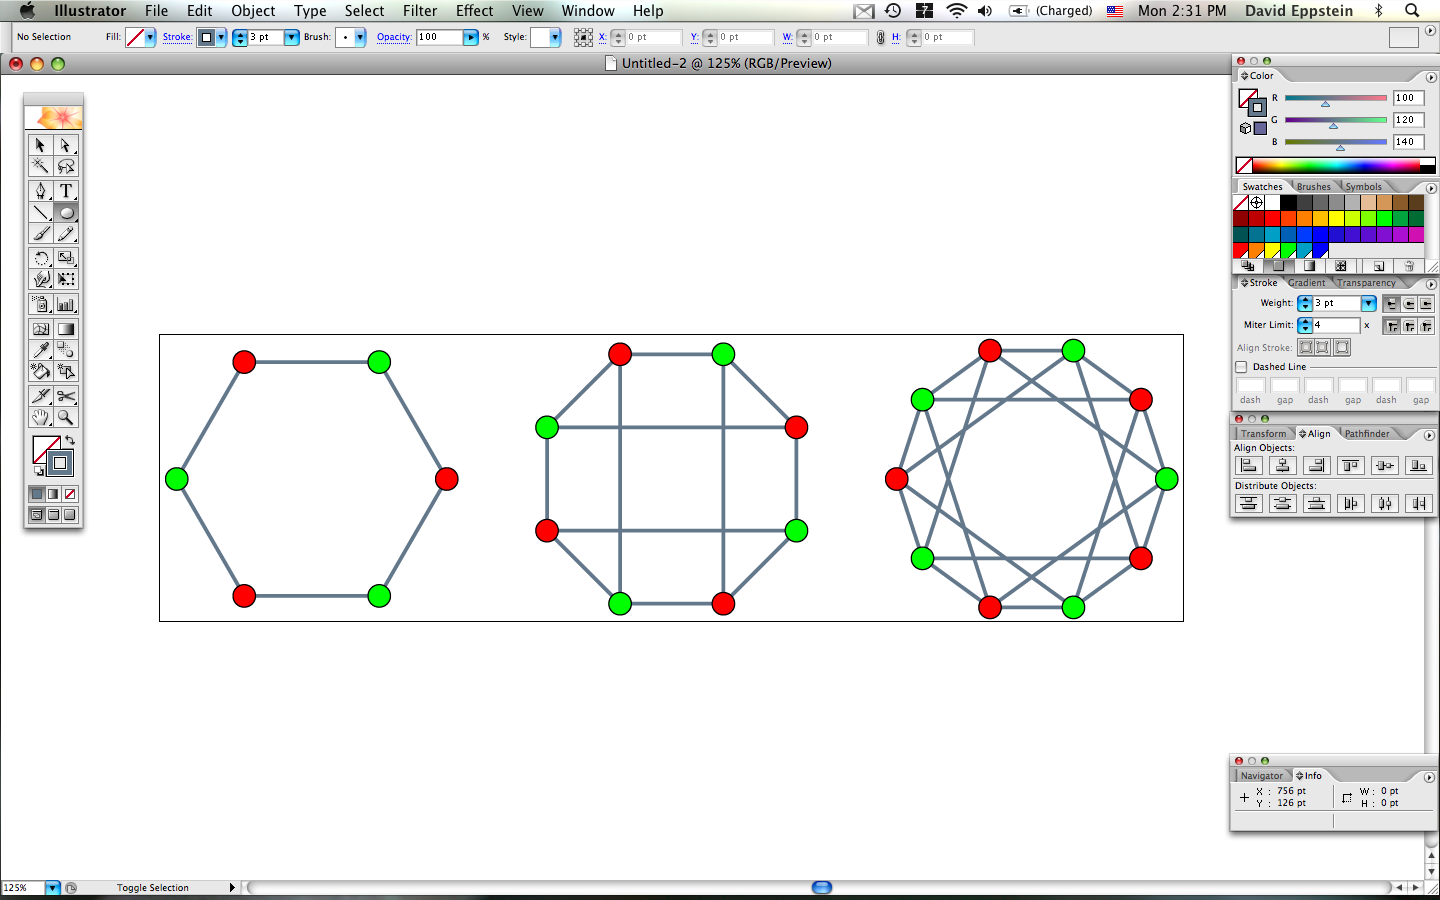
Well, almost finished. The remaining steps aren't so visual, and I didn't take screenshots of them. I saved to an svg file, ran a Python script I've written that converts some of the idiosyncracies of the svg output from my old version of Illustrator into something Wikimedia can handle, uploaded the file to Wikimedia commons (this involves filling out a form saying where the file came from, what it's about, and what free licensing restrictions it might have), and added a link to it from the crown graph article.
Comments:
2009-01-13T02:32:08Z
In some situations reportlab (and similar things, like matplotlib) may speed up your work, avoiding manually laying lines, and creating them computationally: http://www.reportlab.org/downloads.html
2009-01-13T02:39:13Z
I've sometimes used pyx to arrange drawings computationally — see e.g. http://commons.wikimedia.org/wiki/File:Gray_configuration.svg or http://commons.wikimedia.org/wiki/File:Non-Desargues_configuration.svg — and for http://commons.wikimedia.org/wiki/File:Ageev_5X_circle_graph.svg I generated the svg directly as there's no way I would have had the patience to draw it by hand. But for simpler drawings like this one I think it's probably easier just to use a GUI since most of the effort is in choosing sizes and colors rather than in getting everything in its proper position.
2009-01-13T05:13:56Z
I tend to make drawings like this in OmniGraffle, which is a much simpler (and cheaper) program than Illustrator. OmniGraffle is especially nice for drawing graphs; once you draw the nodes and edges, you can drag nodes around and the edges (and their labels) will follow. There are even a few (naive) graph layout algorithms built in. It can also export only the selected objects as SVG or PDF files, with the bounding box automatically set properly for pdflatex (plus a buffer if you want). When I draw a series of related figures, I usually put them all in one file, and then select and export relevant pieces to separate PDF files (select, cmd-shift-E, type file name, return, select, cmd-shift-E, type file name, return, ...).
OmniGraffle isn't very good at drawing curves, and it lacks many of Illustrator's useful tools, so I still fall back on Illustrator for more interesting figures.
2009-01-13T05:27:13Z
Sounds worth a try. Is there a demo version, do you know, or does one have to pay first?
2009-01-13T05:40:34Z
You can download it from http://www.omnigroup.com/applications/omnigraffle/download/. (You probably want the Pro version.) I think it will run in a (mildly crippled) demo mode until you buy a license; at least that's how it used to work.
2009-01-13T22:33:09Z
Did you try this: http://www.fauskes.net/code/dot2tex/? (Never used it, just heard of it.)
2009-01-13T22:44:16Z
I hadn't tried it; thanks for the link.
2009-01-14T01:44:07Z
Thanks, that was indeed helpful; the description of your planning and organization especially. It gives one hope to understand that something is the result of skill, experience and good judgement, not magical powers. :)
2009-01-14T02:45:14Z
You're welcome! But I'm sad to learn that I don't have magical powers.
2009-01-14T10:36:05Z
Could you elaborate on the SVG hoops you jump through, pythonically? I have been somewhat frustrated by exporting nice figures (drawn in OmniGraffle Pro) to SVG, only to see them crippled at Wikimedia. I understand that there are good reasons for this that may have to do with licensing of typefaces. But it’s something of a mystery for me. — Thore
2009-01-14T15:03:29Z
The main things my script does are to expand xml entitites (Wikimedia can't handle them) and standardize font names (the version of Illustrator I have produces font descriptions like font-family:"Times-Regular" when it should be font-family:Times font-style:normal).