Another set of WADS talk slides
Talk slides from my coauthor Elena Mumford's talk on our paper at WADS, "Edges and Switches, Tunnels and Bridges" (also with Marc van Kreveld and Bettina Speckmann) are now online.
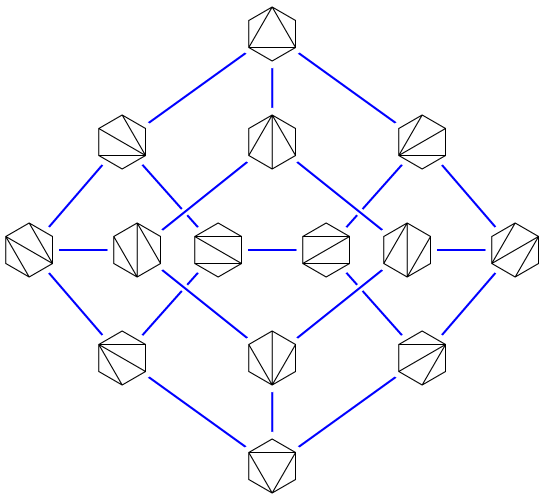
I've written about this here before, I think, but the problem we were studying is one of graph drawing: if one has drawn a graph, in such a way that the edges of the graph are represented by curves in the plane, it is a standard graphical convention (sometimes called "casing") to draw a crossing between two edges by breaking one of the edges as it passes through the crossing, making it look like one of the edges goes over and one of the edges goes under. See, e.g., this drawing of the flip graph of a hexagon, where I drew four crossings with this convention. A convenient way to achieve this effect in a drawing program is to draw two copies of the upper edge, a thick white one and a thin colored one on top of it — the thick white copy provides a margin around the edge that produces the breaking effect whenever it overlies another edge.
But how do we choose which edge to go under and which to go over? In the flip graph example, the graph is the skeleton of a polyhedron and I could use that three-dimensional information to make the decisions, but for other graphs the choice is less obvious.
Our paper defines three different models for what kinds of over-under relations are allowed: (1) the choices may be made independently at each crossing, (2) there must be a global above-below ordering of all the edges (this is necessary e.g. if one is using the thick-white-copy technique to create the drawing), or (3) the over-under relations must come from the projection of a set of line segments in three dimensions. We also define several different measures of the quality of a casing: edges should not be underneath other edges for too many crossings in a row, there should be as few as possible alternations between over and under on a single edge, etc. So we end up with a big two-dimensional table of different optimization problems, some of which we solve and some of which turn out to be NP-complete.
The talk slides are necessarily condensed, because it was only a 20 minute talk, but I think they do a good job of introducing the subject and describing our results on one of the entries in the table. For more, read the paper.
In other graph drawing publication news, my paper with Dujmović, Suderman, and Wood, "Drawings of Planar Graphs with Few Slopes and Segments", has now been published in CGT&A; I briefly wrote about it earlier, when I put a preprint of it on the arxiv. And, I also updated my online pub list with the page numbers from my two WADS papers.